Corfu Navision 2016, Data, Development Tips, Dimension, Excel, Functional Tips, How To, Information, Tip & Tricks

How to attach additional 6 Shortcut Dimensions to Dimension Set when copy data to Journal from Excel


In my previous post I explained how we can copy data to-and-fro between Excel and Navision. Also we saw the limitation of additional 6 Shortcut Dimensions neither can be exported nor imported back.

Today we will see solution to this limitation, as it is required from several customers and we keep getting request for same. The same reader for whom I have posted my previous post have requested similar need.

If you missed my previous post you can find here : Copying data to-and-fro between Excel & Navision

Let us see how we can get this part working, yes it will require a small customization to get this working. Below I explain the steps we require to achieve this.

My example refers to Table 81 & Page 39. You can do same with other Journals too.

We will Add Custom Fields for these additional 6 Shortcut Dimensions.


ExcelToNavJnl-8

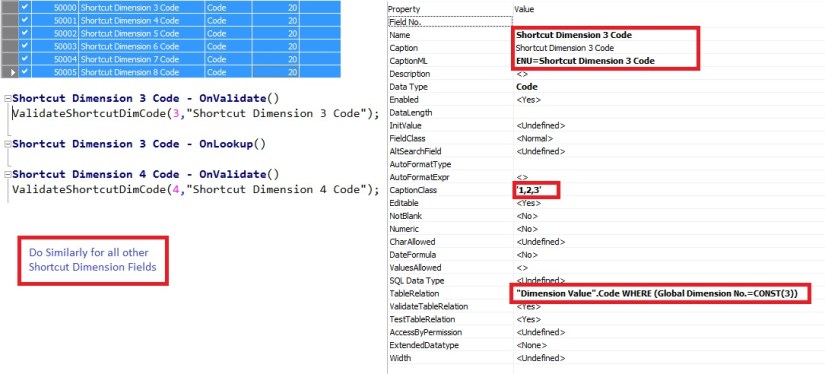
Add the Fields and write the above code to OnValidate trigger and set the Property accordingly for all of the 6 Shortcut Dimension Fields.

ExcelToNavJnl-9

Similarly add a piece of code to OnInsert trigger of the Table.

ExcelToNavJnl-10

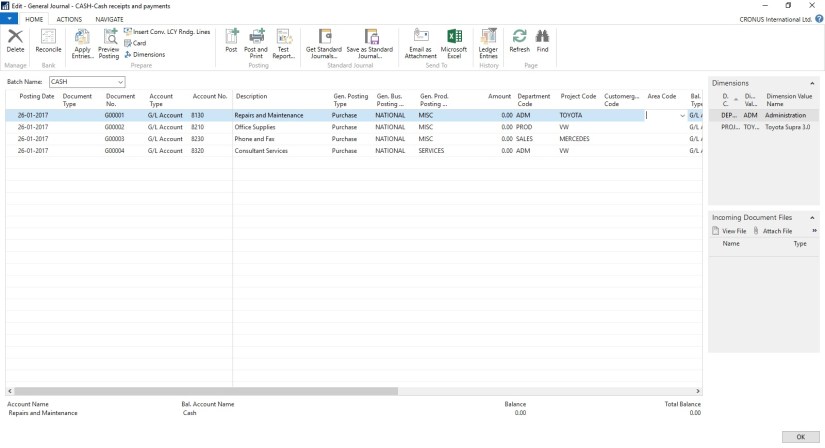
Add our newly created Fields to Page too.

Now Let us check if it works as expected.

ExcelToNavJnl-11


Perform the operation as in previous post, this time add the newly created fields for Dimensions as shown in above screen.

If you missed my previous post you can find here : Copying data to-and-fro between Excel & Navision

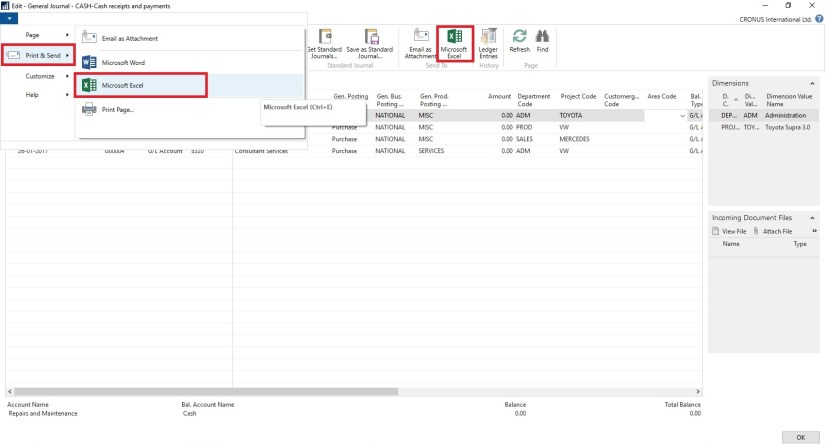
Export and Import back by adding value to these additional Dimensions 1 &2 is Global 3-6 is my additional Shortcut Dimensions, 7-8 I have not included as not setup in my database.

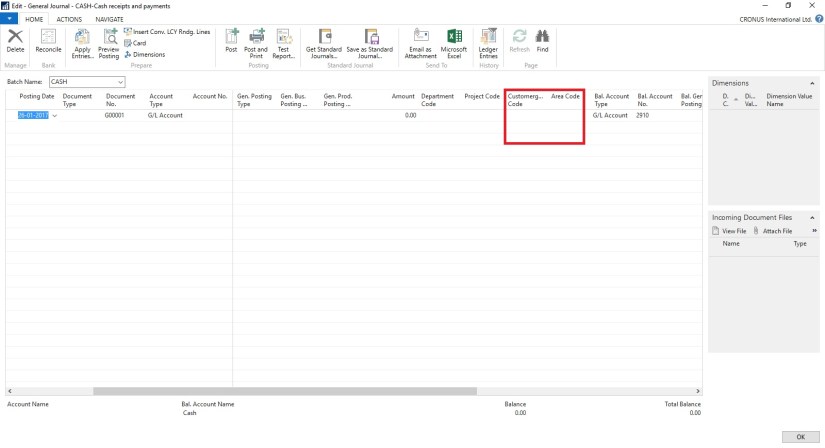
After importing back check the Dimensions and you will find due to above customization my all the Shortcut Dimensions are attached to Dimension Set Entry.
ExcelToNavJnl-12

Yes we are done.

I will come up with more information in my upcoming posts. Till then keep exploring and Learning.


Advertisement
Corfu Navision 2016, Data, Development Tips, Dimension, Excel, Functional Tips, How To, Information, Tip & Tricks

Copying data to-and-fro between Excel & Navision

ExcelToNavJnl

One of my reader has requested to show him how to export data from Nav Journal to Excel, perform correction and import back to Navision.

So let us see how can we perform this and what are the limitations.

Open the Journal in Navision.

Arrange and show all the Fields that you want to export to Excel on the page.

Fill some sample data. Say single line of Journal, way usually you do.

ExcelToNavJnl-2

Now Send to Excel using options shown in below screen.

ExcelToNavJnl-3

Data will get Exported to Excel.

Have you noticed something, with the data that got exported yo Excel?

Your 2 Additional Shortcut dimension was not Exported to Excel. Customer Group Code & Area Code, why?

Since these are not the actual fields in the table and it is calculated on Page level, so you will only be able to export Dim-1 & Dim-2 your Global Dimensions which is available as Field in the Table.

Make sure you enter Dimension Values in Capitals in Excel Columns.

ExcelToNavJnl-4

Now perform required changes to the Journal data.

Insert New Lines, Delete existing Lines or Edit existing Lines.

Make sure you don’t keep more than 30000 to 40000 lines, until this it works fine if more than this either performance is too slow or Navision gets hang while you copy back your data to Navision. Upto 40000 works fine have tested several time. Depending upon your system performance you can decide how much data will be ok for you.

ExcelToNavJnl-5

As we have seen above my 2 additional Dimensions is missing from the exported data. We need to match the columns what we have in our Excel and sequence. So we will hide/remove the additional columns from the Journal to match the sequence from Excel columns before we copy back our data from Excel to Navision.

ExcelToNavJnl-6

Select the Rows in excel containing you data excluding header columns and copy.

Return to your Journal and Paste as shown in above screen.

ExcelToNavJnl-7

Your modified data is imported back to the Journal in Navision.

Now perform the Journal action way you do normally.


Convert to PDF, Development Tips, Excel, How To, Information, Office Integration, Tip & Tricks, Word

Appending other information to Navision Reports

There is always requirement from many customers to Append information to the Navision Reports.

Recently one of my reader have requested me for any such functionality which can help him Append information from Word or Excel Files to Navision Reports.

While searching for solution for such requirement i came across this scope if we can do the same from outside Navision integrating the functionality with Navision.

Although i am not sure how much this post will answere to the requirement raised by my this reader but still this can be an work around to this requirement.

In my previous 2 posts i have answered this approach, Let us assemble all of them to provide solution to this requirement.

Please see my privious posts, i will not repeat already covered part in this post. Here is the link to those posts:

Converting Office Files into PDF from Navision

Merging PDF Files in Navision

In this post i will be using these functions discussed in above posts.

The Same Setup will be applicable to this post too.

PDFConvMerge-2-2

Since we are appending our other information to the Navision Report so we will be at First Step saving our Customer Sales Invoice to PDF.

Later some information which need to be appended to this report is in Word File the path of which is stored on Customer Card.

How to work with Converting Office file to PDF is already discussed in previous post Link shared above.

So Now we have Our Report in PDF and Additional information to be appended to Report is also in PDF. Now it will be easy for us to Merge both the File to have single PDF File.

How to Merge these files is also already discussed in my previous post. Link shared above.

Let us see how we can assemble above both functionality to get our required result.

Approach is very simple, i have created a button on Sales Invoice to Print the Report which performs above discussed process.

PDFConvMerge-5

On Sales Invoice Page I have added one Button which calls my Function to Print & Merge the document, it takes Invoice No & Sell-to Customer No. as a parameter.

PDFConvMerge-6

I have created a function to Save the output of Report to PDF, using standard functionality available in Navision.

PDFConvMerge-7

The PrintSalesInvoice function called from Sales Invoice Page with Invoice No & Sell-to Customer No.

This Function calls the SaveReportAsPDF explained above.

Converts the Office file that is attached on Custommer Card, discussed in previous post Link provided above.

Calls the MergePDFFiles, discussed in previous post Link provided above.

So Now at single click of Button entire task is done for us.

To keep it simple no additional checks and other routine tasks have been included like after task is completed clean up of all temporary files and moving the Result file to desired Location etc.

Now you know the logic so you can tweak the code accordingly to get the functionality working as per your requirement.

Thats all for this post. I will come up with more information in my up coming posts.

You keep you requirements posting to me, i will try my best to answer your queries in form of my future posts, at earliest possible from my end.

Till then kee exploring & Learning.

Convert to PDF, Development Tips, How To, Information, Office Integration, Tip & Tricks, Word

Converting Office Files into PDF from Navision

Today in this post i will walkthrough how we can convert any MS Office File into PDF.

It have been many time required to convert any attached file with the record in Navision to PDF format.

To perform this action we will require a tool which can be downloaded from:

OfficeToPDF download link :- http://officetopdf.codeplex.com/releases/view/118190

Extract and save the OfficeToPDF.exe file to some Folder.

For this Walkthrough i have created a Field in Customer Table to save the File Path of the Office File which we want to convert into PDF.

PDFConvMerge-1

You can add Dialog box to select the File from the specified Folder.

For this demo i have kept it simple Text Field where you can add your File Path and Office File Name. It is assumed that only Office File will be attached here.

For Setup purpose i have created one Setup Table & Page where we will store our other required Folder paths.

PDFConvMerge-2

Here we have given provision to save the Path of the Office to PDF Convertor Tool file Path & Temporay working Folder.

I have used the shared folder for all the paths so that it is not system specific, also make sure you give required permission on this folder for all the operating accounts.

Now our Next task will be to write a function which will perform this conversion part.

PDFConvMerge-3

Above Function Takes the File Name from the Customer Card we stored above on Customer Card. Takes the Path of the Office To PDF Convertor Utility and Tmp working Folder.

Prepares the PDF file Name along with Path stored in Setup.

Prepares the command to invoke Convert Utility using WsShell and returns the PDF file File Name along with path as defined in the Setup.

Now you can use this File for futher purpose as required.

To keep it simple no additional code of test and other required routine task is not added.

Now you know the Logic you can tweak the functionality as per your requirement.

I will comeup with more information in my up comming posts, till then keep exploring and learning.


PivotTable, PowerBI.com, PowerPivot, Tip & Tricks

Microsoft Power BI – Part X

Continuing from my previous post. Today we will downloading the dataset into Excel from Power BI Online for analysis.

In case you have missed my previous posts here I present the link to all previous posts below.


Microsoft Power BI – Part – I

Introduction to Power BI and Creating Report from Excel Data, Local Files.

Microsoft Power BI – Part – II

Introduction to few Features of Power BI

Microsoft Power BI – Part – III

Power BI Desktop, Creating Dataset & Reports from In Premise Database installation

Microsoft Power BI – Part – IV

Power BI Gateway usage

Microsoft Power BI – Part – V

Scheduling Refresh of Dataset & Report created using In Premise Database

Microsoft Power BI – Part – VI

Power BI Content Pack

Microsoft Power BI – Part – VII

Power BI Mobile App

Microsoft Power BI – Part – VIII

Power BI Content Pack

Microsoft Power BI – Part – IX

Power BI Publisher for Excel


Login to Power BI using your credentials.

PowerBI-111

Select the Dataset which you wish to analyse, click the three dots on right and from appearing menu choose ANALYZE IN EXCEL.

PowerBI-112

You will be prompted for Analyse in Excel (preview). If you are running first time please install it.

At the same time you will be prompted for (.odc) MS Office Data Connection file to save/open.

Save and then open the File in Excel.

PowerBI-113

On opening the file you will be prompted for security concern Enable to allow it.

PowerBI-114

You will be able to see Pivot Table Fields, containing all of the Tables available in the Dataset.

PowerBI-115

Now you can play with your data to analyse and create Pivot, Charts and share with others or you can Pin back your result to Power BI Dashboards using concept we used in our previous post.


That’s all for today, I will come up with more features in my future posts.

Till then keep practicing & Learning.


PowerBI.com, Tip & Tricks

Microsoft Power BI – Part IX

Continuing from my previous post. Today we will see usage of Power BI Publisher for Excel.

In case you have missed my previous posts here I present the link to all previous posts below.

Microsoft Power BI – Part – I

Introduction to Power BI and Creating Report from Excel Data, Local Files.

Microsoft Power BI – Part – II

Introduction to few Features of Power BI

Microsoft Power BI – Part – III

Power BI Desktop, Creating Dataset & Reports from In Premise Database installation

Microsoft Power BI – Part – IV

Power BI Gateway usage

Microsoft Power BI – Part – V

Scheduling Refresh of Dataset & Report created using In Premise Database

Microsoft Power BI – Part – VI

Power BI Content Pack

Microsoft Power BI – Part – VII

Power BI Mobile App

Microsoft Power BI – Part – VIII

Power BI Content Pack

Sharing key Excel insights just got easier. Save snapshots of important PivotTables, Charts, cell ranges, and more from across all of your spreadsheets to a single location quickly with the Power BI publisher for Excel. Simply highlight the elements you want to save, then click the “Pin to” button: now you’ve got a powerful web dashboard that you can share with everyone in your organization.

Let us see how we can use this feature.

Login to Power BI with your credentials.

PowerBI-95

From Download Menu Section choose Power BI Publisher for Excel.

Or visit Link: https://powerbi.microsoft.com/en-us/excel-dashboard-publisher/

PowerBI-96

Select your desired Excel Version 32 or 64 bit as installed on your PC and download the Package.

Close your Excel and Install the Package and follow on screen guide.

After Installation when you open your Excel First time after Installing the Package. You will get similar to below screen.

PowerBI-97

Sign in with your Power BI Credentials.

PowerBI-98


PowerBI-99


PowerBI-100

I have created a Pivot in excel as below which I want to share on my Desktop.

PowerBI-101

Select the Region/Range that you wish to publish from Power BI choose Pin, as shown below.

PowerBI-102

In my case I have already pined so confirmation Dialog Box is taken else it will Pin the Selected Range as a snapshot on selected Workspace.

PowerBI-103

Make sure you select right Workspace before you Pin.

PowerBI-104

After Publishing you will get confirmation as below.

PowerBI-105

Using the Link, Login with your credentials to the Power BI and switch to the Dashboard on which you published.

PowerBI-106

This way you can Pin Snapshot of PivotTables, Charts, cell ranges, and more. You can update existing with new one and manage all your Pins.

PowerBI-107

Save your Excel and Exit.

PowerBI-108

Try useful feature.

I will come up with more details in my future posts.

Till then keep practicing and learning using online Blogs, help and documents.

Data Model, Development Tips, Excel, How To, Information, Instalation & Configuration, Office Integration, PivotTable, Power View, PowerBI.com, PowerPivot

PowerPivot in Excel 2013

I started the series in End of September and Starting of October on PowerPivot, Power View, PivotTable & Reports but in-between the release of Navision 2016 all the topics got scattered between other posts and I didn’t ended the topic.

Here I present all the posts link at one place which you can use as table of content for easy access and to help if any one wish to start from beginning and learn all the features & Topic on same.

PowerPivot for Excel

Start the Power Pivot in Microsoft Excel add-in

Troubleshooting: Power Pivot Ribbon Disappears

PowerPivot Creating a Data Model in Excel 2013

Adding more tables to the Data Model using Existing Connection – In PowerPivot

Add relationships to Data Model in PowerPivot

How to add Filter for data retrieval in PowerPivot Data model.

Create a calculated column in PowerPivot

Creating My First Report using PowerPivot

Basics of Power Pivot for Excel – 2013

Add Slicers to PivotTables in PowerPivot

Power View in Excel 2013

Import data using copy and paste from Excel sheet or other source for PowerPivot Data Model.

Add Excel Sheet/Table to the PowerPivot Data Model

Add a relationship using Diagram View in Power Pivot

Extend the Data Model using calculated columns

Create a hierarchy in PowerPivot Data Model

Use hierarchies in PivotTables

Create a Power View report

Create a calculated field in PowerPivot

Set field defaults in PowerPivot

Set Table Behaviour in PowerPivot

Set Data Categories for fields in PowerPivot

I will come up with more details once I get some time to explore and find anything which I feel is good to share with the community.

Till then keep Learning, Exploring and Practicing.

Data Model, Development Tips, Excel, How To, PivotTable, PowerPivot, Report

Use hierarchies in PivotTables

Recall from my previous post Create a hierarchy in PowerPivot Data Model, We will continue from where we left our earlier post.

Now we have a Sports hierarchy and Locations hierarchy, we can add them to PivotTables or Power View, and quickly get results that include useful groupings of data.

Prior to creating hierarchies, you had to add individual fields to the PivotTable, and arrange those fields how you wanted them to be viewed.

In this post we will use the hierarchies created in the previous post to quickly refine our PivotTable.

Open the Excel workbook which we used in our previous post and Insert PivotTable as shown in below screen.
ExcelData-17

  • Add field in the PivotTable Medal from Medal Table in the FILTERS area, and Count of Medal from Medal Table in the VALUES area. Your nearly empty PivotTable should look like the following screen.

ExcelData-18

  • From the PivotTable Fields area, drag SDE from the Events table to the ROWS area. Then drag Locations from the Hosts table into the COLUMNS area. Just by dragging those two hierarchies, your PivotTable is populated with a data, all of which is arranged in the hierarchy we defined in the previous steps. Your screen should look like the following screen.

ExcelData-19

  • You can expand any of those Sports in the PivotTable, which is the top level of the SDE hierarchy, and see information in the next level down in the hierarchy (discipline). If a lower level in the hierarchy exists for that discipline, you can expand the discipline to see its events. You can do the same for the Location hierarchy, the top level of which is Season, which shows up as Summer and Winter in the PivotTable.

ExcelData-20

ExcelData-21
By dragging those two hierarchies, you quickly created a PivotTable with interesting and structured data that you can drill into, filter, and arrange.

I will come up with more details and other options on this topic in my upcoming posts. Till then keep learning and practicing.

Data Model, Development Tips, Excel, How To, PowerPivot, Report

Add Excel Sheet/Table to the PowerPivot Data Model

Download the Excel file from the link provided in previous post.

Import data using copy and paste from Excel sheet or other source for PowerPivot Data Model.

Open the Workbook:

ExcelData-3

Select sheet one by one and Add to Data model of PowerPivot.

ExcelData-4

Make sure all Table/Sheet is added to Data Model of PowerPivot.

I have create a sample Excel File for you which you can down load from the Shared Path using link: http://1drv.ms/1GpZFd4

This file have couple of sheets having data related to Olympics which I have compiled from MS Office support site.

You can find the link on the Menu of my blogsite too to access the shared files.

I will be using this file for couple of walkthrough in my upcoming posts.

Data Model, Development Tips, Excel, PowerPivot

Import data using copy and paste from Excel sheet or other source for PowerPivot Data Model.

You can copy & Paste data from an Excel workbook, or import data from a table on a web page, or any other source from which we can copy and paste into Excel. In the following steps, you add the data from a table.

  • Insert a new Excel worksheet, and give it the name desired any meaningful name that describes the data.
  • Select and copy the data, including the table headers.
  • In Excel, place your cursor in cell A1 of the above created worksheet and paste the data.
  • Format the data as a table. You press Ctrl + T to format the data as a table, or from HOME > Format as Table. Since the data has headers, select My table has headers in the Create Table window that appears.

ExcelData-1

  • Name the table. In TABLE TOOLS > DESIGN > Properties locate the Table Name field, and type desired name.

ExcelData-2

  • Format your data using Excel std. formatting tool.
  • Save the workbook.This file have couple of sheets having data related to Olympics which I have compiled from MS Office support site.
  • You can find the link on the Menu of my blogsite too to access the shared files.
  • I have create a sample Excel File for you which you can down load from the Shared Path using link: http://1drv.ms/1GpZFd4

I will be using this file for couple of walkthrough in my upcoming posts.