Data, Development Tips, How To, Information, PowerBI.com, Tip & Tricks

App for Power BI REST APIs for Streaming Data

In this post we will see how to create app to use the Power BI REST APIs for Streaming Data.

Full documentation: https://powerbi.microsoft.com/documentation/powerbi-service-real-time-streaming/

To run this app follow the steps discussed in my previous post: [Real-Time Dashboard Tile & Streaming Dataset– in Power BI]

Summary as below:

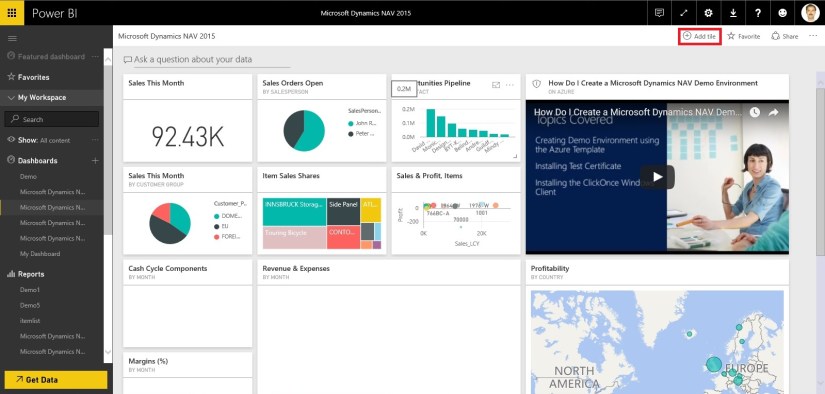
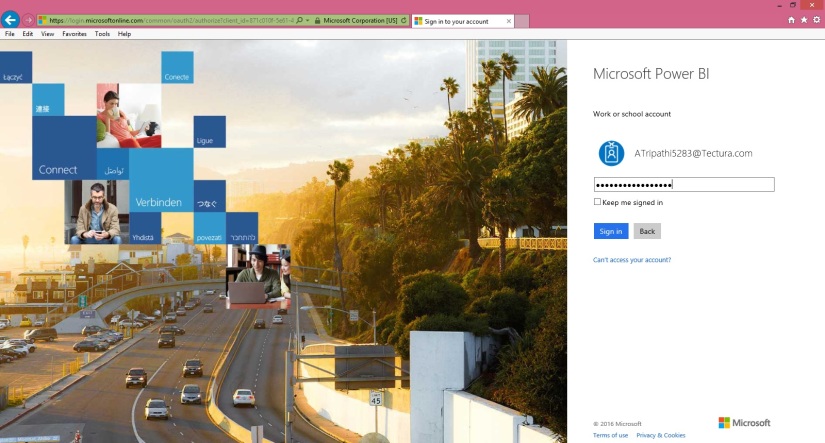
  1. Go to app.powerbi.com
  2. Go to streaming data management page by via new dashboard > Add tile > Custom Streaming Data > manage data
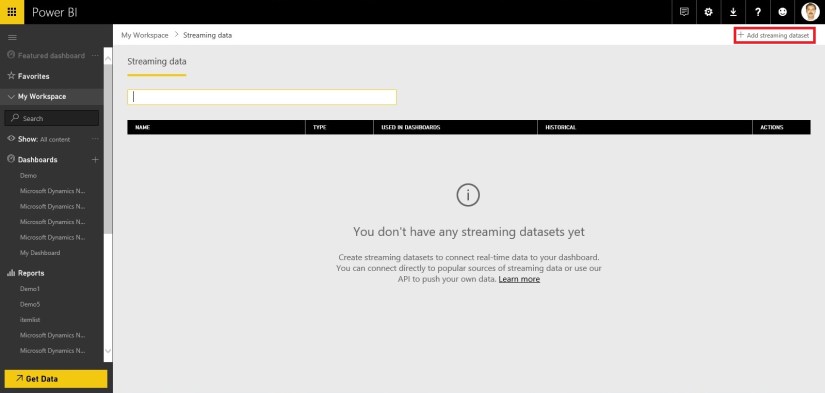
  3. Click “Add streaming dataset”
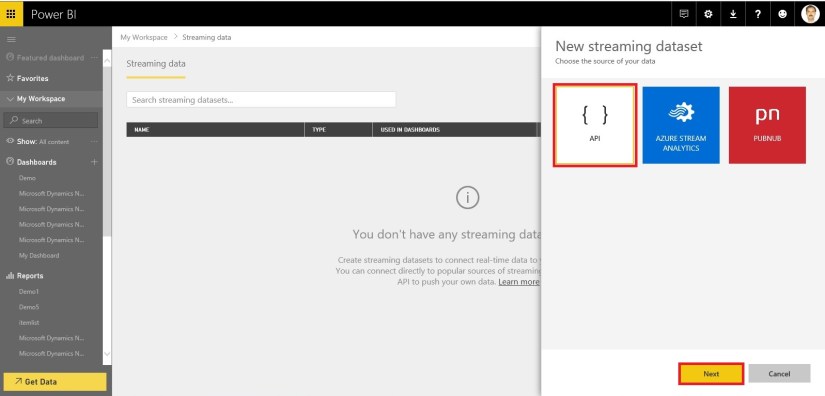
  4. Select API, then Next, and give your streaming dataset a name
  5. Add a field with name “Customer ID”, type Number
  6. Add a field with name “Customer Name”, type Text
  7. Add a field with name “Sales Value”, type Number
  8. Click “Create”
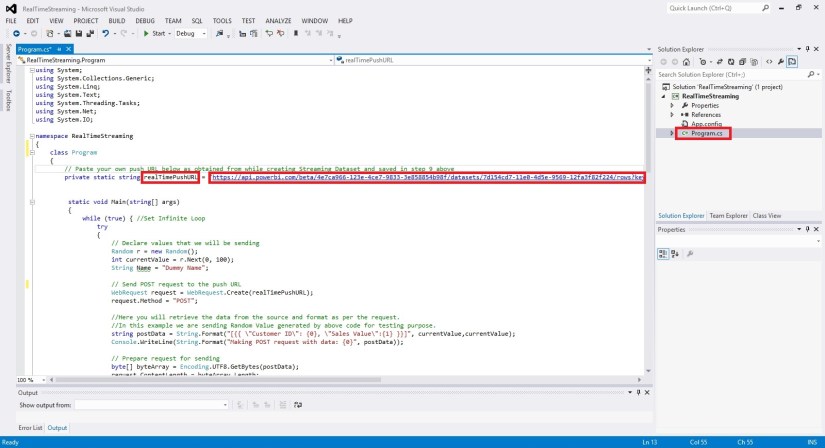
  9. Copy the “push URL” and paste it as the value of “realTimePushURL” in below app

We will start with new project in Visual Studio.

RealTimeSync-12

Create a new Visual C# Console Application.

Open the Program.cs File and write a code as shown below.

This app Uses the WebRequest sample code as documented here: https://msdn.microsoft.com/en-us/library/debx8sh9(v=vs.110).aspx

RealTimeSync-13

For your easy here is the code of Program.cs below:


using System;

using System.Collections.Generic;

using System.Linq;

using System.Text;

using System.Threading.Tasks;

using System.Net;

using System.IO;


namespace RealTimeStreaming

{

class Program

{

// Paste your own push URL below as obtained from while creating Streaming Dataset and saved in step 9 above

private static string realTimePushURL = “https://api.powerbi.com/beta/4e7ca966-123e-4ce7-9833-3e858854b98f/datasets/7d154cd7-11e0-4d5e-9569-12fa3f82f224/rows?key=mD1nkJOf426PjPPaEQsW9xEg%2FN1EENQ2hRZvXIpHr%2BTXNk3XQpKsR2Jbe5CATiMoLmxjlzSp%2FIMlbe9HL8G4xQ%3D%3D”;

static void Main(string[] args)

{

while (true) { //Set Infinite Loop

try

{

// Declare values that we will be sending

Random r = new Random();

int currentValue = r.Next(0, 100);

String Name = “Dummy Name”;

// Send POST request to the push URL

WebRequest request = WebRequest.Create(realTimePushURL);

request.Method = “POST”;


//Here you will retrieve the data from the source and format as per the request.

//In this example we are sending Random Value generated by above code for testing purpose.

string postData = String.Format(“[{{ \”Customer ID\”: {0}, \”Sales Value\”:{1} }}]”, currentValue,currentValue);

Console.WriteLine(String.Format(“Making POST request with data: {0}”, postData));


// Prepare request for sending

byte[] byteArray = Encoding.UTF8.GetBytes(postData);

request.ContentLength = byteArray.Length;

// Get the request stream.

Stream dataStream = request.GetRequestStream();

// Write the data to the request stream.

dataStream.Write(byteArray, 0, byteArray.Length);

// Close the Stream object.

dataStream.Close();

// Get the response.

WebResponse response = request.GetResponse();

// Display the status.

Console.WriteLine(String.Format(“Service response: {0}”, ((HttpWebResponse)response).StatusCode));

// Get the stream containing content returned by the server.

dataStream = response.GetResponseStream();

// Open the stream using a StreamReader for easy access.

StreamReader reader = new StreamReader(dataStream);

// Read the content.

string responseFromServer = reader.ReadToEnd();

// Display the content.

Console.WriteLine(responseFromServer);

// Clean up the streams.

reader.Close();

dataStream.Close();

response.Close();

}

catch (Exception ex)

{

Console.WriteLine(ex);

}

// Wait 5 second before sending

System.Threading.Thread.Sleep(5000);

} //Infinite Loop ends here.

}

}

}

Compile and Run the Program.

RealTimeSync-14

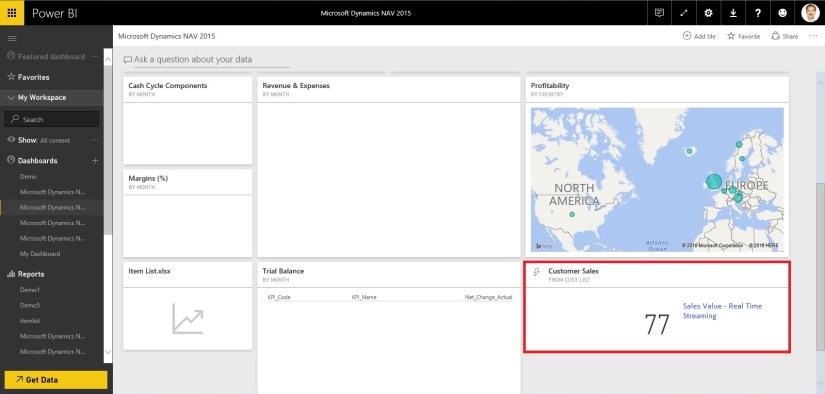
Leave the Program Running and switch to Power BI dashboard. You will see your newly created Tile in previous post will be displaying the Random Value generated by this program updating every 5 seconds.

That’s all with little tweaking to this program you can fetch your data and send the updated data to your Real Time Streaming Dataset.

That’s end to this post.

I will come up with more details in my upcoming posts.

Till then keep Exploring and learning.


Advertisement
Data, Data Model, Development Tips, How To, Information, PowerBI.com, Tip & Tricks

Real-Time Dashboard Tile & Streaming Dataset– in Power BI

Power BI have introduced real-time dashboard tiles – a lightweight, simple way to get real-time data onto your dashboard. Real-time tiles can be created in minutes by pushing data to the Power BI REST APIs or from streams you’ve created in Azure Stream Analytics or PubNub, a popular real-time streaming service. Let’s see how we can do in no time.

Login to your Power BI using your credentials.

Go to your dashboard where you wish to add Real Time Streaming Tile, choose “Add a tile”

RealTimeSync-1

Select the “Custom streaming data” option

RealTimeSync-2

Click on Next.

RealTimeSync-3

At first usage you may not be having Streaming Dataset, if you have List will be shown.

Let’s create one for our Example, Click the link – Manage Data.

RealTimeSync-4

Click on Add Streaming Dataset.

RealTimeSync-5

From New Streaming Dataset, Select API and click on Next.

RealTimeSync-6

Add your Dataset Name, Fields and Datatypes.

Once you are done, Click on Create.

RealTimeSync-7

Copy your Push URL, we will require this to push data to Data Stream.

Click On Done.

RealTimeSync-8

Returning to our Previous Step, Now we can see Streaming Dataset Available.

Select your Dataset and Click on Next.

RealTimeSync-9

Select the Type of Visualization you want, and Fields to display.

Click on Next.

RealTimeSync-10

Give Title, Subtitle to your Tile and click on Apply.

RealTimeSync-11

Bravo, you are done, your Tile will be added on your Dashboard.

But hold on, the Value will not come until you add logic to push data to the Tile.

Now we will move to our Next Step, where we will create a program to call Power BI REST API and push Streaming data to our Dashboard. Checkout my next post for same. [App for Power BI REST APIs for Streaming Data]

Till then keep Exploring & Learning. I will return soon with my next post.


PivotTable, PowerBI.com, PowerPivot, Tip & Tricks

Microsoft Power BI – Part X

Continuing from my previous post. Today we will downloading the dataset into Excel from Power BI Online for analysis.

In case you have missed my previous posts here I present the link to all previous posts below.


Microsoft Power BI – Part – I

Introduction to Power BI and Creating Report from Excel Data, Local Files.

Microsoft Power BI – Part – II

Introduction to few Features of Power BI

Microsoft Power BI – Part – III

Power BI Desktop, Creating Dataset & Reports from In Premise Database installation

Microsoft Power BI – Part – IV

Power BI Gateway usage

Microsoft Power BI – Part – V

Scheduling Refresh of Dataset & Report created using In Premise Database

Microsoft Power BI – Part – VI

Power BI Content Pack

Microsoft Power BI – Part – VII

Power BI Mobile App

Microsoft Power BI – Part – VIII

Power BI Content Pack

Microsoft Power BI – Part – IX

Power BI Publisher for Excel


Login to Power BI using your credentials.

PowerBI-111

Select the Dataset which you wish to analyse, click the three dots on right and from appearing menu choose ANALYZE IN EXCEL.

PowerBI-112

You will be prompted for Analyse in Excel (preview). If you are running first time please install it.

At the same time you will be prompted for (.odc) MS Office Data Connection file to save/open.

Save and then open the File in Excel.

PowerBI-113

On opening the file you will be prompted for security concern Enable to allow it.

PowerBI-114

You will be able to see Pivot Table Fields, containing all of the Tables available in the Dataset.

PowerBI-115

Now you can play with your data to analyse and create Pivot, Charts and share with others or you can Pin back your result to Power BI Dashboards using concept we used in our previous post.


That’s all for today, I will come up with more features in my future posts.

Till then keep practicing & Learning.


Report

Designing Report Layouts from the Microsoft Dynamics NAV Development Environment

After you have created a dataset for a report, you design the report layout. The report layout determines how the report looks when it is viewed, printed, and saved from the Microsoft Dynamics NAV client. The report layout specifies which fields of the dataset are included in the report and how they are arranged, the format of text that appears on the report (such as font type and color), margins, background images, and more.

You generally display most data in the body of a report, and you use the header to display information before any dataset fields are displayed. For example, you can display a report title, company, and user information in the header of a report.

Report Layout Types

There are two types of report layouts: Word and Client Report Language Definition (RDLC). Word report layouts are based on a Word document (.docx file type) and are created and modified by using Word 2013. RDLC report layouts are .rdlc or .rdl file types that are created and modified by using Visual Studio 2013 or SQL Server Report Builder 3.0.

Built-in and Custom Report Layouts

In the Microsoft Dynamics NAV Development Environment, you can create both an RDLC report layout and Word report layout on a report. These layouts are referred to as built-in layouts because they are part of the report object in the database. This means, for example, if you export the report object as a .fob or .txt file, the RDLC report layout and Word report layout are included. A report can only have one built-in RDLC report layout and one built-in Word report layout. By default, the built-in RDLC report layout is used when the report is run in the Microsoft Dynamics NAV client unless there is only a built-in Word report layout, in which case, the built-in Word report layout is used.

Microsoft Dynamics NAV users can specify whether to use the built-in RDLC or Word report layout on a report from the Microsoft Dynamics NAV Windows client and Microsoft Dynamics NAV Web client. From the client, users can also create custom report layouts that are based on the built-in report layouts. This enables users to have several different layouts for the same report which they can switch among. Custom report layouts are managed from page 9650 Report Layouts in the Microsoft Dynamics NAV client. Unlike built-in report layouts, which are part of the report object, custom report layouts are stored in table 9650 Report Layouts of the database.

Report Layouts in a Multitenant Deployment

In a multitenant Microsoft Dynamics NAV deployment, the built-in report layouts are stored in the application database because they are part of the report objects. Therefore, built-in report layouts are available to all tenants. Custom report layouts are stored in the business data database; therefore they are specific to the tenant. This enables you to create separate report layouts for each tenant.

Report

Add Fields from a Report Dataset to a Word Report Layout

A report dataset can consist of fields that display labels, data, and images. This topic describes procedure for adding fields of a report dataset to an existing Word layout of a report. You add fields by using the Word custom XML part for the report and adding content controls that map to the fields of the report dataset.

To display the Custom XML part for the Report in Word

  1. Open the Word report layout document in Word for editing.
  2. Show the Developer tab in the ribbon of Word.

By default, the Developer tab is not shown in the ribbon.

  1. On the Developer tab, choose XML Mapping Pane.
  2. In the XML Mapping pane, in the Custom XML Part list, choose the XML part for Microsoft Dynamics NAV report. The name of the XML part has the following format:

urn:microsoft-dynamics-nav/reports/report_name/ID

report_name is the name that is assigned to the report as specified by the report’s Name Property.

ID is the identification number of the report.
XMLDataSet
After you select the XML part, the XML Mapping pane displays the labels and field controls that are available for the report.

To add a label or data field

  1. Place your pointer in the document where you want to add the control.
  2. In the XML Mapping pane, right-click the control that you want to add, choose Insert Content Control, and then choose Plain Text.

AddDataField

Note

You cannot add a field by manually typing the dataset field name in the content control. You must use the XML Mapping pane to map the fields.

To add repeating rows of data fields to create a list

  1. If not already existing, add a table row that includes a column for each field that you want repeated.

This row will act as a placeholder for the repeating fields.

  1. Select the whole row.
  2. In the XML Mapping pane, right-click the control that corresponds to the report data item that contains the fields that you want repeated, choose Insert Content Control, and then choose Repeating.

AddRepeatingField

  1. Add the repeating fields to the row as follows:
    1. Place your pointer in a column.
    2. In the XML Mapping pane, right-click the control that you want to add, choose Insert Content Control, and then choose Plain Text.

InsertContentField

  1. For each field, repeat steps a and b.
Report

Adding Image Fields

A report dataset can include a field that contains an image, such as a company logo or a picture of an item. To add an image from the report dataset, you insert a Picture content control.

Images align in the top-left corner of the content control and resize automatically in proportion to fit the boundary of the content control.

Important
You can only add images that have a format (such as .bmp, .jpeg, and .png file types), which that is supported by Word. If you add an image that has a format that is not supported by Word, you will get an error when you run the report from the Microsoft Dynamics NAV client.

To add an image

  1. Place your pointer in the document where you want to add the control.
  2. In the XML Mapping pane, right-click the control that you want to add, choose Insert Content Control, and then choose Picture.
  3. To increase or decrease the image size, drag a sizing handle away from or towards the center of the content control.

AddImage