Alert, Development Tips, How To, Information, PowerBI.com, Tip & Tricks

Working with Alerts in Power BI

Knowing about changes to important metrics quickly some time can help you taking quick decisions or help you keep eyes on things you care most.

With data driven alerts in Power BI, you can now get notifications when a metric you care about on your dashboard exceeds a set threshold.

Alert notifications will be sent to you as an email, and appear in your notification center on the web and in mobile apps.

You can set alerts for your numeric tiles featuring cards and gauges only. You have control over how often you want to be notified about your data, and whether you want to receive an email when your data goes beyond the limits you set.

Only you can see the alerts you set, even if you share your dashboard.

Alerts only work on data that is refreshed. When data refreshes, Power BI looks to see if an alert is set for that data. If the data has reached an alert threshold, an alert is triggered.

Alerts only work with numeric data types.

Alerts only work on data that is refreshed. They do not work on static data.

Today we will see how to work with Alert feature in Power BI.

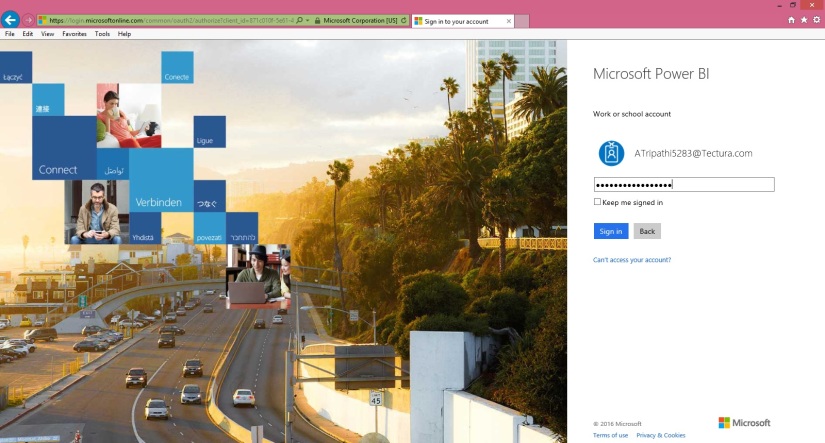
Login to your Power BI using your credentials.

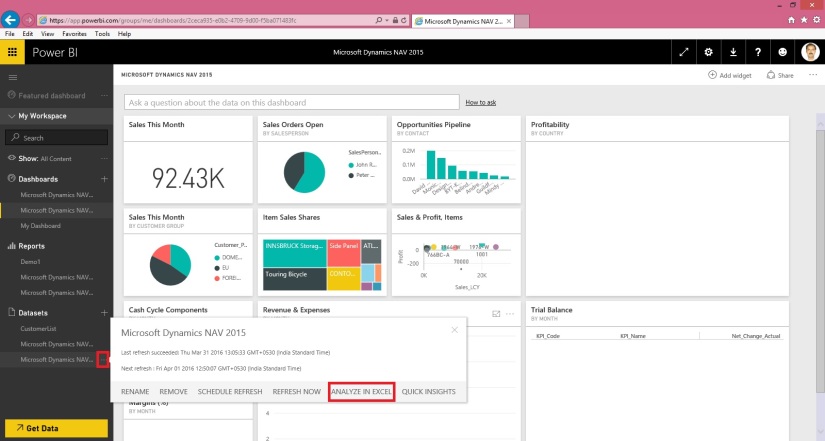
Switch to your Dashboard.

I have one ready to use dashboard from my previous post to show Alert feature I am using the same.

As discussed above it works only for Numeric & Gauges Tiles only, for others you will not get even the Alert option.

Luckily I have one on my Dashboard, if want to learn how to create Numeric Tiles or more details on working with Power BI you can refer to any of my previous posts on Power BI. However you can find here one direct Link to the topic in question.

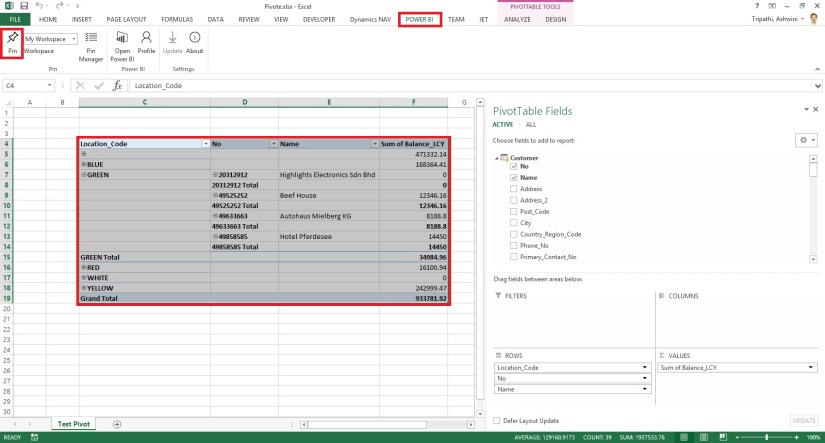
You see I have selected my Numeric Tile in below screen shot.

DataAlert-1

How to Set Data Alerts:

From a dashboard tile, select the ellipses.

Select the bell icon  to add one or more alerts.

DataAlert-2

Click on Add Alert Rule.

To start, ensure the Active slider is set to ON, and give your alert a title.

DataAlert-3


Set your Condition, Threshold, and Notification Frequency also don’t forget to tick on send me mail too.

Click on Save to save your Alert.


Receiving alerts:

When the data being tracked reaches one of the thresholds you’ve set, several things will happen.

Power BI checks to see if time have lapsed or more than depending on the option you selected since the last alert was sent.

As long as the data is past the threshold, you’ll get an alert every hour or every 24 hours depending on option you selected.

If you’ve set the alert to send you an email, you’ll find something like as shown in below screen, this in your Inbox.


DataAlert-4


Power BI will add a message to your Notification center and adds a new alert icon to the applicable tile as shown in below screen.

DataAlert-5


Access to your Notification.

DataAlert-6


Manage alerts:

There are three ways to manage your alerts:

From the dashboard tile

From the Power BI Settings menu

On an individual tile in the Mobile App

DataAlert-7


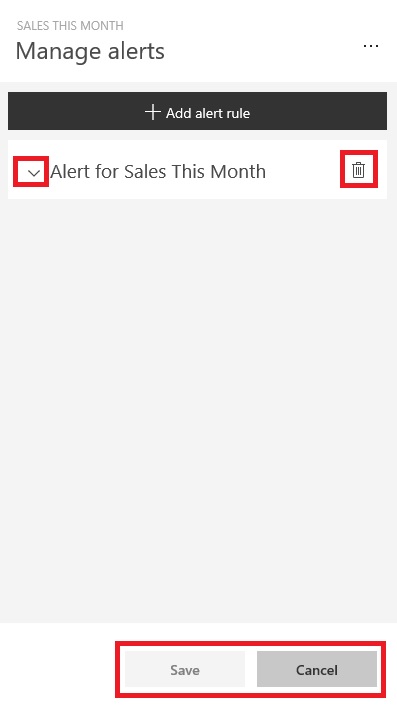
As we have seen above how to create Alerts follow same steps to access Alert Window.

At the Left click on Expand make Necessary Modifications and save.

At the right select the trashcan to delete the Alert.

Select cancel to return to previous window.


DataAlert-8

From here you can turn alerts on and off, open the Manage alerts window to make changes, or delete the alert.


That’s all for today.

I will come up with more details in my upcoming posts.

Till then keep exploring and learning.


Development Tips, How To, Information, PowerBI.com, Tip & Tricks

Happy First Birthday to Power BI!

One year ago, on July 24, 2015, the new Power BI service was released, Power BI Desktop, and Power BI Mobile as an innovative cloud-based business intelligence solution.

At the time of the launch, Microsoft Corporate Vice President James Phillips wrote that “Power BI sets the standard for modern business intelligence”.

You can read more on :- https://powerbi.microsoft.com/en-us/blog/happy-first-birthday-to-power-bi/

I have written several posts for beginers you can find here:

In case you have missed my previous posts here I present the link to all previous posts below.

Microsoft Power BI – Part – I

Introduction to Power BI and Creating Report from Excel Data, Local Files.

Microsoft Power BI – Part – II

Introduction to few Features of Power BI

Microsoft Power BI – Part – III

Power BI Desktop, Creating Dataset & Reports from In Premise Database installation

Microsoft Power BI – Part – IV

Power BI Gateway usage

Microsoft Power BI – Part – V

Scheduling Refresh of Dataset & Report created using In Premise Database

Microsoft Power BI – Part – VI

Power BI Content Pack

Microsoft Power BI – Part – VII

Power BI Mobile App

Microsoft Power BI – Part – VIII

Power BI Content Pack

Microsoft Power BI – Part – IX

Power BI Publisher for Excel

Microsoft Power BI – Part – X

ANALYZE IN EXCEL.

Search the Blog site with PowerBI tag and you will find more posts explaing about PowerBI features and capabilities.

I will comeup with more details in my upcoming posts.

Till then keep exploring & Learning.


Development Tips, How To, Information, Power Bi Content Pack, PowerBI.com, Tip & Tricks

Microsoft Power BI – My Organization Content Pack Library

Continuing from my previous post. Today we will discuss about Content Pack Library (My Organization) in Power BI.

In case you have missed my previous posts here I present the link to all previous posts below:

Microsoft Power BI – Part – I

Introduction to Power BI and Creating Report from Excel Data, Local Files.

Microsoft Power BI – Part – II

Introduction to few Features of Power BI

Microsoft Power BI – Part – III

Power BI Desktop, Creating Dataset & Reports from In Premise Database installation

Microsoft Power BI – Part – IV

Power BI Gateway usage

Microsoft Power BI – Part – V

Scheduling Refresh of Dataset & Report created using In Premise Database

Microsoft Power BI – Part – VI

Power BI Content Pack

Microsoft Power BI – Part – VII

Power BI Mobile App

Microsoft Power BI – Part – VIII

Power BI Content Pack

Microsoft Power BI – Part – IX

Power BI Publisher for Excel

Microsoft Power BI – Part – X

Analyse in Excel (preview)

PowerBI-47

Login to Power BI using your credentials.

OrgPowerContent-1

Select Get Data.

OrgPowerContent-2

From Content Pack Library section select Get Data under My Organization.

OrgPowerContent-3

Select Create content pack.

OrgPowerContent-4

This is the part where majority of work to be performed.

In First Section – Choose who will have access to this content pack

You have 2 option

  1. You can share with specific users or Groups, since your AD is in sync with your in premise AD you can select them.
  2. You can share with your entire Organization.

Select the Group or Users if you go with first option.

In Second Section – Provide Title for you Content Pack

In Third Section – Provide detailed Description for your content pack.

OrgPowerContent-5

In Fourth Section – You can select Image for your content pack.

Finally in Fifth Section you will define what all content you want to share for the user using this content pack.

Here all available contents are divided under 3 sections (Dashboards, Reports & Datasets).

When you select Dashboard all included Reports and Dataset will be shared by default.

When you select Reports all included Datasets will be shared by default.

When you select Dataset only that will be shared.

You can select combination as you desire.

I will provide write up why we will select selective contents to share with case study, in my future post some time other.

Once you are done with all above step you are good to Publish the Content Pack.

OrgPowerContent-6

If we revisit the Get Data option again for My Organization, we can view our Published Content Pack which we shared with others.

User can customize as per his need and Share with others in form of New Content Pack or as-it-is depends.

Good Example will be we have one Content Pack for My Organization which include all modules Dashboard, Reports and Datasets.

My IT will create Module wise Content Pack (Finance, Sales, Purchase, Warehouse, Manufacturing etc…) and share these content packs with concern department Heads. Further each Heads will create sub-content pack and share with their team with information which is related to them and so on.


That’s all for today, will come up with more information in my future posts.

Till then keep exploring and learning.


Maderia, PowerBI.com, Tip & Tricks

Project “Madeira” content pack for Power BI

Maderia1

Getting insights into your Project “Madeira” data is easy with the Project “Madeira” content pack for Power BI. Power BI retrieves your data and then builds an out-of-the-box dashboard and reports based on that data. This blog post announces the availability of the Project “Madeira” content pack for Power BI.

Check out this Link.

The content pack is preconfigured to work with sales data and financial data from the demonstration company that you get when you sign up for the Project “Madeira” preview. – Choose any visual on the dashboard to bring up one of seven underlying reports. – Filter the report or add fields that you want to monitor. – Pin this customized view to the dashboard to continue tracking. The dashboard and underlying reports refresh daily. You can control the refresh schedule and modify the frequency on the dataset.

The data is extracted from your Project “Madeira” company using web services to read live data. In Project “Madeira”, the Web Services window lists the web services that have been set up for you, including the following that are consumed by the content pack in Power BI:

  • ItemSalesAndProfit
  • ItemSalesByCustomer
  • powerbifinance
  • SalesDashboard
  • SalesOpportunities
  • SalesOrdersBySalesPerson
  • TopCustomerOverview


PowerBI.com, Tip & Tricks

Power BI – Overview and Learning

Microsoft Power BI is a collection of online services and features that enables you to find and visualize data, share discoveries, and collaborate in intuitive new ways. There are two experiences now available for Power BI: the new experience, generally referred to as Power BI, and the previous experience which is referred to as Power BI for Office 365.


Please check this link:- Overview and Learning

PowerBI-2


PivotTable, PowerBI.com, PowerPivot, Tip & Tricks

Microsoft Power BI – Part X

Continuing from my previous post. Today we will downloading the dataset into Excel from Power BI Online for analysis.

In case you have missed my previous posts here I present the link to all previous posts below.


Microsoft Power BI – Part – I

Introduction to Power BI and Creating Report from Excel Data, Local Files.

Microsoft Power BI – Part – II

Introduction to few Features of Power BI

Microsoft Power BI – Part – III

Power BI Desktop, Creating Dataset & Reports from In Premise Database installation

Microsoft Power BI – Part – IV

Power BI Gateway usage

Microsoft Power BI – Part – V

Scheduling Refresh of Dataset & Report created using In Premise Database

Microsoft Power BI – Part – VI

Power BI Content Pack

Microsoft Power BI – Part – VII

Power BI Mobile App

Microsoft Power BI – Part – VIII

Power BI Content Pack

Microsoft Power BI – Part – IX

Power BI Publisher for Excel


Login to Power BI using your credentials.

PowerBI-111

Select the Dataset which you wish to analyse, click the three dots on right and from appearing menu choose ANALYZE IN EXCEL.

PowerBI-112

You will be prompted for Analyse in Excel (preview). If you are running first time please install it.

At the same time you will be prompted for (.odc) MS Office Data Connection file to save/open.

Save and then open the File in Excel.

PowerBI-113

On opening the file you will be prompted for security concern Enable to allow it.

PowerBI-114

You will be able to see Pivot Table Fields, containing all of the Tables available in the Dataset.

PowerBI-115

Now you can play with your data to analyse and create Pivot, Charts and share with others or you can Pin back your result to Power BI Dashboards using concept we used in our previous post.


That’s all for today, I will come up with more features in my future posts.

Till then keep practicing & Learning.


PowerBI.com, Tip & Tricks

Microsoft Power BI – Part IX

Continuing from my previous post. Today we will see usage of Power BI Publisher for Excel.

In case you have missed my previous posts here I present the link to all previous posts below.

Microsoft Power BI – Part – I

Introduction to Power BI and Creating Report from Excel Data, Local Files.

Microsoft Power BI – Part – II

Introduction to few Features of Power BI

Microsoft Power BI – Part – III

Power BI Desktop, Creating Dataset & Reports from In Premise Database installation

Microsoft Power BI – Part – IV

Power BI Gateway usage

Microsoft Power BI – Part – V

Scheduling Refresh of Dataset & Report created using In Premise Database

Microsoft Power BI – Part – VI

Power BI Content Pack

Microsoft Power BI – Part – VII

Power BI Mobile App

Microsoft Power BI – Part – VIII

Power BI Content Pack

Sharing key Excel insights just got easier. Save snapshots of important PivotTables, Charts, cell ranges, and more from across all of your spreadsheets to a single location quickly with the Power BI publisher for Excel. Simply highlight the elements you want to save, then click the “Pin to” button: now you’ve got a powerful web dashboard that you can share with everyone in your organization.

Let us see how we can use this feature.

Login to Power BI with your credentials.

PowerBI-95

From Download Menu Section choose Power BI Publisher for Excel.

Or visit Link: https://powerbi.microsoft.com/en-us/excel-dashboard-publisher/

PowerBI-96

Select your desired Excel Version 32 or 64 bit as installed on your PC and download the Package.

Close your Excel and Install the Package and follow on screen guide.

After Installation when you open your Excel First time after Installing the Package. You will get similar to below screen.

PowerBI-97

Sign in with your Power BI Credentials.

PowerBI-98


PowerBI-99


PowerBI-100

I have created a Pivot in excel as below which I want to share on my Desktop.

PowerBI-101

Select the Region/Range that you wish to publish from Power BI choose Pin, as shown below.

PowerBI-102

In my case I have already pined so confirmation Dialog Box is taken else it will Pin the Selected Range as a snapshot on selected Workspace.

PowerBI-103

Make sure you select right Workspace before you Pin.

PowerBI-104

After Publishing you will get confirmation as below.

PowerBI-105

Using the Link, Login with your credentials to the Power BI and switch to the Dashboard on which you published.

PowerBI-106

This way you can Pin Snapshot of PivotTables, Charts, cell ranges, and more. You can update existing with new one and manage all your Pins.

PowerBI-107

Save your Excel and Exit.

PowerBI-108

Try useful feature.

I will come up with more details in my future posts.

Till then keep practicing and learning using online Blogs, help and documents.

PowerBI.com, Tip & Tricks

Microsoft Power BI – Part VIII

Continuing from my previous post. Today we will see usage of Power Content Pack to Refresh in Premise Navision Installation using Personnel Gateway.

Please see my previous post it will help you in continuing with this Walkthrough.

In case you have missed here I present the link to all previous posts here below.

Microsoft Power BI – Part – I

Introduction to Power BI and Creating Report from Excel Data, Local Files.

Microsoft Power BI – Part – II

Introduction to few Features of Power BI

Microsoft Power BI – Part – III

Power BI Desktop, Creating Dataset & Reports from In Premise Database installation

Microsoft Power BI – Part – IV

Power BI Gateway usage

Microsoft Power BI – Part – V

Scheduling Refresh of Dataset & Report created using In Premise Database

Microsoft Power BI – Part – VI

Power BI Content Pack

Microsoft Power BI – Part – VII

Power BI Mobile App

Step -1

Check your Service is up & running, here we are not going to use SLL in fact Personnel Gateway.

PowerBI-86

Step -2

Make sure you Imported your Query Objects required for Power BI Dynamics Nav Content Pack. If you are not using NAV-2016, in my case I am using NAV-2015 for this Walkthrough.

PowerBI-87

Step -3

Make sure your Web Services are published.

PowerBI-88

Step -4

You have installed the Power BI Gateway – Personal and Login to it using your Credentials.

PowerBI-89

Step – 5

Login to PowerBI using your Credentials and choose Get Data from Bottom Left Corner in your Navigation Bar.

PowerBI-90

Step – 6

Connect Your Service using MS Dynamics Content Pack.

PowerBI-91

PowerBI-92

Notice here I am not using https:// also remove any ‘/’ and Service name from the URL.

PowerBI-93

Set your Authentication Mode and Sign In.

PowerBI-94

It will take some moment and your Dataset, Report & Dashboard will be available to you.

Graphical representation and data may vary depending upon data in your database.

We are done.

For further detail on any step you can refer previous posts for any clarifications, Links provided above.

Will come up with more details in my upcoming posts.

Till then keep trying and practicing.


PowerBI.com

Microsoft Power BI for Beginners Table of Content

In March I have written few posts on Power BI keeping in mind who are beginners.

In case you have missed here I present the link to all those posts here below.


Microsoft Power BI – Part – I

Introduction to Power BI and Creating Report from Excel Data, Local Files.

Microsoft Power BI – Part – II

Introduction to few Features of Power BI

Microsoft Power BI – Part – III

Power BI Desktop, Creating Dataset & Reports from In Premise Database installation

Microsoft Power BI – Part – IV

Power BI Gateway usage

Microsoft Power BI – Part – V

Scheduling Refresh of Dataset & Report created using In Premise Database

Microsoft Power BI – Part – VI

Power BI Microsoft NAV Content Pack

Microsoft Power BI – Part – VII

Power BI Mobile App

Microsoft Power BI – Part – VIII

Power BI Content Pack

Microsoft Power BI – Part – IX

Power BI Publisher for Excel

Microsoft Power BI – Part – X

ANALYZE IN EXCEL

I will come up with more features and other important details in my future posts.

You can find lots of materials on Power BI here : https://powerbi.microsoft.com/en-us/

https://powerbi.microsoft.com/en-us/learning/

PowerBI-85


PowerBI.com

Microsoft Power BI – Part – VII

Continuing from my previous post, if you have not seen yet please check it out it will help you continuing with this post.

You can check:

Microsoft Power BI – Part – I

Microsoft Power BI – Part – II

Microsoft Power BI – Part – III

Microsoft Power BI – Part – IV

Microsoft Power BI – Part – V

Microsoft Power BI – Part – VI


PowerBI-75

Open the powerbi.com and go to download link of mobile app : https://powerbi.microsoft.com/en-us/mobile/

I have Android so I am selecting Google Play, you select appropriate link as per your mobile OS.

PowerBI-76

Login with your Google account and choose Install.

Alternatively you can install from your mobile browser.

PowerBI-77

Search for Microsoft Power BI and Install the app.

PowerBI-78

Once the App is Installed Open the App.

PowerBI-79

From Home Screen Select Get Started.

PowerBI-80

Give your Login details as registered by Power BI and Sign In.

PowerBI-81

Complete your credentials and Sign In.

Once you are Login, Choose Start Exploring.

PowerBI-83

You will get all available Dashboard on your Power BI Portal.

PowerBI-84

Now you can browse and see your Reports pinned on your Dashboard.

Application have other features need to be explored, different version and on different OS platform you may find features bit different. The app is getting updated from time to time including more features and performance issues.

I will come up with more details on this topic in my upcoming posts.

Till then keep exploring and Learning from different sources available online via blogs and online help on powerbi.com.