Development Tips, Dynamics 365, How To, Information, Maderia, Office Integration, Power Bi Content Pack, PowerBI.com, Tip & Tricks, Troubleshooting Tips, Web Services

Working with Project “Madeira” Content Pack for Power BI

In today’s post we will see how to use Power BI Content Pack for Madeira.

The content pack is preconfigured to work with sales data and financial data from the demonstration company that you get when you sign up for the Project “Madeira” preview.

To see your Project “Madeira” data in Power BI, you must have the following:

  • Access to Project “Madeira”.
  • Access to Power BI.

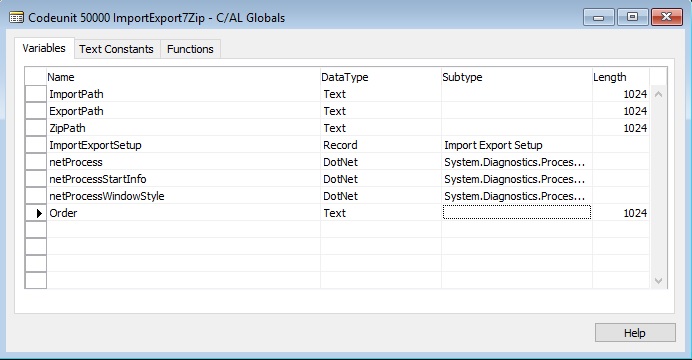
Before we start with connecting we will collect few information that we will require while connecting the Power BI to fetch data from Madeira.

User Name

Web Service Acess Key

Note down both value, if you don’t have Web Service Access Key Generate one and set appropriate Expiration date or Set Never Expire as shown below.

PowerBi_Madeira-1

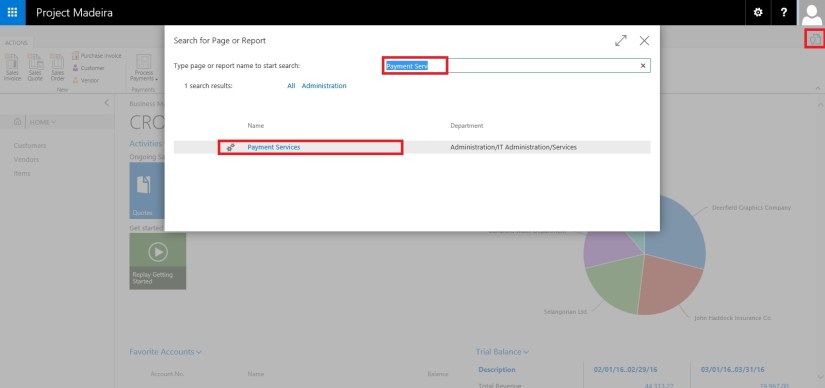
Next open the Web Service Page.

Make sure all selected Web Service is running as in below screen.

The data is extracted from your Project “Madeira” company using web services to read live data. In Project “Madeira”, the Web Services window lists the web services that have been set up for you, including the following that are consumed by the content pack in Power BI:

  • ItemSalesAndProfit
  • ItemSalesByCustomer
  • powerbifinance
  • SalesDashboard
  • SalesOpportunities
  • SalesOrdersBySalesPerson
  • TopCustomerOverview

Note: If you change the name of any of these web services, the data will not show up in Power BI.

Note your URL of OData. Edit it to follow the format one shown in below screen.

PowerBi_Madeira-2

Now we have all our required information.

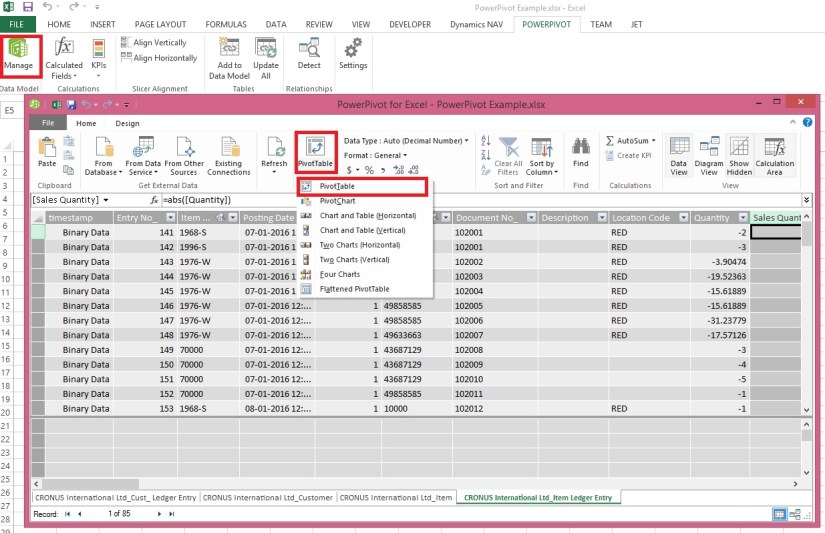
Open Power BI site and Get Data from Services as shown in below screen.

PowerBi_Madeira-3

Select Project “Madeira” Content Pack and click on Get.

PowerBi_Madeira-4

Enter the URL of Web Service we get in above step.

PowerBi_Madeira-5

Select Next.

Select Authentication method as Basic.

In User Name enter your user name as obtained in above step.

For Password ented the Web Service Access Key as obtained in above step.
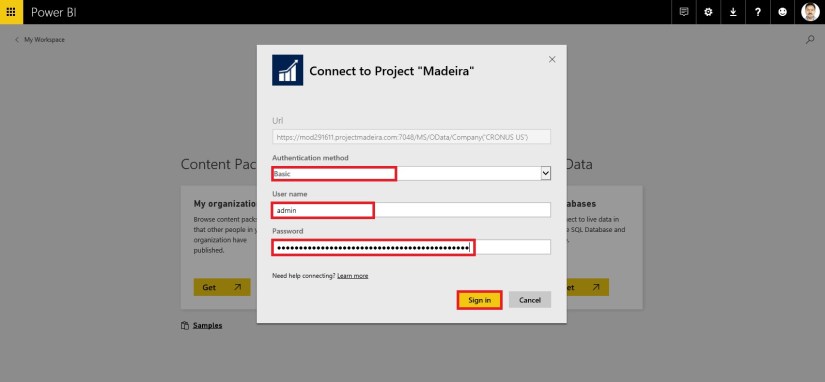
PowerBi_Madeira-6

Choose Sign In.

After few minutes/seconds churning you will be ready with your first Dashboard from Madeira.

PowerBi_Madeira-7

Troubleshooting

“Parameter validation failed, please make sure all parameters are valid”
If you see this error after you enter your Project “Madeira” URL, make sure the following requirements are satisfied:

“Login failed”
If you get a “login failed” error when you log in to the dashboard, using your Project “Madeira” credentials, then this can be caused by one of the following issues:

  • The account you are using does not have permissions to read the Project “Madeira” data from your account.

    Verify your user account in Project “Madeira”, and make sure that you have used the right web service access key as the password, and then try again.

  • The Project “Madeira” instance that you are trying to connect to does not have a valid SSL certificate. In this case you’ll see a more detailed error message (“unable to establish trusted SSL relationship”).

    Note: Self-signed certificates are not supported.

“Oops”
If you see an “Oops” error dialog after you pass the authentication dialog, this is most frequently caused by a problem connecting to the data for the content pack.

Thats all for today’s post.

I will comeup with more details in my upcomming posts.

Til then keep exploring and learning.


Advertisement
How To, Information, Instalation & Configuration, Maderia, Tip & Tricks

Using Payment Services – in Madeira

It’s obvious you know we can include link in PDF documents, if you don’t know no issues everything is not known to every one until he uses it or someone inform them. Today we will be learning this feature for making payments using links in your PDF invoices generated from Madeira.

If you had setup the preview this feature is already available in CRONIUS US demo company.

How do we Setup:

Login to Madeira Project using your Credentials.

Click on Search Page from right top corner.

Search for Payment Services page.

PayPalPayment-1


PayPalPayment-2

Open the Page.

Click on Setup and enter your details as shown in above screen.

Click on Maximize button and Show more to see more details.

PayPalPayment-3

Payment Service Link:

In the CRONUS US demonstration company, the payment link inserted into invoices will link to the PayPal test site.

For your actual Company, we will set so that the payment link will point to the real PayPal site, where payments can be made.

It is advisable that not to do this up for the Actual Company until Project “Madeira” is generally available for purchase. And authorized documentation on this feature is released from Madeira.

If you have setup Always Include on Document then you need not to perform any additional step, but in case you want to add the Payments Service Link to individual invoices that too can be done.

Manually Selecting Payment Services:

Open your Invoice on which you want to include this option.

PayPalPayment-4

As you can see in above Invoice no Payment Service is included.

Click on the Lookup on right side of the field.

PayPalPayment-5

Select the Payment Service from the list of available Services, and click on OK.

PayPalPayment-6

When you send the invoice to your customer the Payment Service Link will be included in the Invoice PDF.

PayPalPayment-7


PayPalPayment-8


PayPalPayment-9


PayPalPayment-10

How it will look in Invoice:

The PDF will contain the link to your selected Payment Service using which your customer can do the payment.

PayPalPayment-11

Stay tuned for more Information in upcoming posts.

Till then keep exploring and learning.


Corfu Navision 2016, Development Tips, How To, Information

Using Argument Tables in Navision

When creating functions we sometimes need a lot of parameters to give the information we require. Number of arguments/parameters to function have limits.

Sometimes these parameters are optional, only required in some scenarios.

This makes calling them quite hard. The code becomes hard to read & understand, and sometimes spread across multiple lines.

When changing the signature of any std. function or already implemented functionality which is highly used over the system in several objects you might end up changing an endless chain of objects.

Imaging adding a field to such function, or change a datatype. The amount of code affected is pretty big and if you need to parameter only for one specific case you end up changing a lot of code for no purpose. Does this make sense?

These challenges can be solved by grouping commonly used arguments in a single table and use that table as the parameter of a function.

So the solution is to create a single table that holds the contract for the function.

When we add new fields to the table, we effectively do not change the signature of the function hence this acts as overloading allowing optional parameters to change the behavior of the code.

You can find usage of such Argument Tables in below objects:

Type      ID            Name

1              9500       Email Item

5              260         Document-Mailing

5              9520       Mail Management

Table is created to hold Parameter Values which will be passed to the function.

ArgumentTables-1

This Function in Table Pass the record as a parameter to the function, basically this is passing 10 Parameters using single record as a Parameter to the Function.

ArgumentTables-2

In Codeunit Document-Mailing below function, This is the extra work which you will be required to perform, if you miss this part you may not get errors at compile time but all the 10 Parameters will be passed as blank. This may be counted as side-effect of using such concept.

ArgumentTables-3

In Codeunit Mail Management below function, This Pass the record as a parameter to the function, basically this is passing 10 Parameters using single record as a Parameter to the Function.

ArgumentTables-4

In Codeunit Mail Management below function, This receives the record as a parameter to the function, basically this is receiving 10 Parameters using single record as a Parameter to the Function.

ArgumentTables-5

Best part is Argument tables can be outside of a customer’s license file since we never insert data in the SQL Server database.

For more details you can see this Link. https://community.dynamics.com/nav/w/designpatterns/245.argument-table


Corfu Navision 2016, Development Tips, How To, Tip & Tricks

Zip/Un-Zip files using 7Zip

Dear friends today I am sharing functionality created in Navision which can be used to zip or Un-Zip files. Upon request of one of follower of my blog I decided to discuss on this point.

Here below I present below how we can do the same. The variables, functions and process is self-explanatory.

Step 1: Let us create a Setup Table and Page

Zip-UnZip-1

Zip-UnZip-2

Zip-UnZip-3

Step 2: Let us define variables

Zip-UnZip-4

Name                                                    DataType             Subtype                    Length

netProcess                                         DotNet                 System.Diagnostics.Process.’System, Version=4.0.0.0, Culture=neutral, PublicKeyToken=b77a5c561934e089′

netProcessStartInfo                       DotNet System.Diagnostics.ProcessStartInfo.’System, Version=4.0.0.0, Culture=neutral, PublicKeyToken=b77a5c561934e089′

netProcessWindowStyle              DotNet System.Diagnostics.ProcessWindowStyle.’System, Version=4.0.0.0, Culture=neutral, PublicKeyToken=b77a5c561934e089′

ImportPath                                         Text                                                        1024

ExportPath                                         Text                                                         1024

ZipPath                                                 Text                                                        1024

ImportExportSetup                         Record                  Import Export Setup

Order                                                    Text                                                          1024 

Step 3: Let us create a Function to Get Information of Path from Setup:

Zip-UnZip-5

This function is to initialize all the required variables which will be used in other functions.

It takes value from the Setup created above to store path of required folders. 

Step 4: Let us create a Function for running Shell Command for 7zip Files:

Zip-UnZip-6

This function runs the shell script in background to Zip or Un-Zip files in specified folder.

Step 5: Let us create a Function to call UnZip file after preparing the Parameters for Command

Zip-UnZip-7

This function prepares the path, Name of File and Argument for the Shell and finally calls the Shell function to run the command in background. At the end of function you will get UnZiped files from the Zip file.

Step 6: Let us create a Function to call Zip file after preparing the Parameters for Command

Zip-UnZip-8

Zip-UnZip-9

This function prepares the path, Name of File and Argument for the Shell and finally calls the Shell function to run the command in background. At the end of function you will get Ziped file which contains the file specified in InclusiveFiles.

This way you can use above functions to Zip / Un-Zip files using 7Zip.


Corfu Navision 2016, Development Tips, How To, TryFunction

Using Try Functions in Navision 2016

You may have seen in different programing language concept of try… catch…

The try-catch statement consists of a try block followed by one or more catch clauses, which specify handlers for different exceptions.

When an exception is thrown, the language looks for the catch statement that handles this exception. If the currently executing method does not contain such a catch block, the language looks at the method that called the current method, and so on up the call stack. If no catch block is found, then the language displays an unhandled exception message to the user and stops execution of the program.

The try block contains the guarded code that may cause the exception. The block is executed until an exception is thrown or it is completed successfully.

Although the catch clause can be used without arguments to catch any type of exception, this usage is not recommended. In general, you should only catch those exceptions that you know how to recover from.

A throw statement can be used in a catch block to re-throw the exception that is caught by the catch statement.

You can also re-throw an exception when a specified condition is true.

Now Dynamics Navision 2016 introduces this concept in C/AL in terms of function.

Try functions in C/AL enable you to handle errors that occur in the application during code execution.

For example, with try functions, you can provide more user-friendly error messages to the end user than those thrown by the system.

You can use try functions to catch errors/exceptions that are thrown by Microsoft Dynamics NAV or exceptions that are thrown during .NET Framework interoperability operations.

Try functions catch errors similar to a conditional Codeunit.Run function call, except with the following differences:

Try function calls do not require that write transactions are committed to the database.
Changes to the database that are made with a try function are not rolled back.

Creating a Try Function

To create a try function, add a function in C/AL code of an object (such as a codeunit) as usual, and then set the TryFunction Property property to Yes. A try function has the following restrictions:

In test and upgrade codeunits, you can only use a try function on a normal function type, as defined by the FunctionType Property (Test Codeunits) or FunctionType Property (Upgrade Codeunits).
The try function cannot have a user-defined return value.
Understanding Try Function Behavior and Usage

A function that is designated as a try function has a Boolean return value (true or false). A try function has the construction OK:= MyTryFunction.

If a try function call does not use the return value, the try function operates like an ordinary function and errors are exposed as usual.

If a try function call uses the return value in an OK:= statement or a conditional statement such as IF-THEN, errors are caught.

You can use the GETLASTERRORTEXT Function to obtain errors that are generated by Microsoft Dynamics NAV.

To get details of exceptions that are generated by .NET Framework objects, you can use the GETLASTERROROBJECT Function to inspect the Expection.InnerException property. You can see codeunit 1291 – DotNet Exception Handler.

If you call the GETLASTERRORTEXT function immediately after you call the CLEARLASTERROR function, then an empty string is returned.

The result of the GETLASTERRORCODE Function is not translated into the local language. The result of the GETLASTERRORTEXT function is translated into the local language.

TryFunction usage concept you can find throughout the system especially for Posting Preview, Applying Entries, and Printing Reports etc. in several codeunits.

However to give simple sight on usage of same I am using my below defined example.

I have created a codeunit with TryFunction to add an Item to Item Table.
TryFunction-1

I created another codeunit with function which calls the above codeunits AddItem function passing parameter to function. Testing it if it is successful or any error occurred while performing the action. 
TryFunction-2
When I execute the second codeunit in first run it says successful as Item dosen’t exists in the table. When I execute for second time it gives error as the item was already added to the table in its first run.
TryFunction-3

Above example also demonstrates the usage of ClearLastError, GetLastErrorCode and GetLastErrorText functions.

Spend some time in scanning other codeunits for better understanding about TryFunctions.

You can see the example provided by Microsoft MSDN also to understand usage of TryFunction.

The following example illustrates the use of a try function together with codeunit 1291 DotNet Exception Handler to handle .NET Framework Interoperability exceptions. The code is in text file format and has been simplified for illustration. The CallTryPostingDotNet function runs the try function TryPostSomething in a conditional statement to catch .NET Framework Interoperability exceptions. Errors other than IndexOutOfRangeException type are re-thrown.

[TryFunction]

PROCEDURE TryPosting@1);

BEGIN

CODEUNIT.RUN(CODEUNIT::”Purch.-Post”);

END;

PROCEDURE CallTryPostingDotNet @2();

VAR

MyPostingCodeunit@1 : Codeunit 90;

MyDotNetExceptionHandler@2 : Codeunit 1291;

IndexOutOfRangeException@3 : DotNet ‘mscorlib, Version=4.0.0.0, Culture=neutral, PublicKeyToken=b77a5c561934e089′.System.IndexOutOfRangeException’

BEGIN

IF TryPostSomething THEN

MESSAGE(‘Posting succeeded.’)

ELSE BEGIN

MyDotNetExceptionHandler.Collect;

IF MyDotNetExceptionHandler.TryCastToType(IndexOutOfRangeException) THEN

MESSAGE(‘The index used to find the value was not valid.’)

ELSE

MyDotNetExceptionHandler.Rethrow;

END;

END;

I will come up with more details in my upcoming posts.

Corfu Navision 2016, Development Tips

Using a Timestamp Field in Navision 2016

Each table in Microsoft Dynamics NAV includes a hidden timestamp field.

The timestamp field contains row version numbers for records as maintained in SQL Server.

You can expose the timestamp field in a table, and then write code against it, add filters, and so on, similar to any other field in a table.

However, you cannot write to the timestamp field.

A typical use of the timestamp field is for synchronizing data changes in tables, when you want to identify records that have changed since the last synchronization.

For example, you can read all the records in a table, and then store the highest timestamp value. Later, you can query and retrieve records that have a higher timestamp value than the stored value.

To set up a timestamp field in a table

  1. In the development environment, open the table, and then add a field of the data type BigInteger.

Specify a name for the field, such as timestamp.

You can specify any valid name for field; you are not restricted to use timestamp.

  1. Open the field properties, and then set the SQL Timestamp property to Yes.

For demo purpose I am adding this field to table 330 – Currency Exchange Rate
Timestamp-1

Now when I run the table in RTC I see value automatically populated in this field.
Timestamp-2

I will come up with more details in my future posts.

Data Model, Development Tips, Excel, How To, PowerPivot, Report

Extend the Data Model using calculated columns

Recall from my previous post Add a relationship using Diagram View in Power Pivot

Which I have left with below note. I will be continuing from where I left my previous post.

It’s nice when the data in your Data Model has all the fields necessary to create relationships, and mash up data to visualize in Power View or PivotTables. But tables aren’t always so cooperative, so in today’s post will describe how to create a new column, using DAX that can be used to create a relationship between tables.

Open the Olympics Excel sheet which we used in our previous post.

ExcelData-7
Delete the column EditionID from sheet Medals & Hosts Table/Sheet.
ExcelData-8

After deleting the Column EditionID from Table/Sheet Select Update All in Ribbon from PowerPivot Tab. This will update the column in Data Model.

Since we are going to learn creating relationship on calculated fields.

In Hosts, we can create a unique calculated column by combining the Edition field (the year of the Olympics event) and the Season field (Summer or Winter). In the Medals table there is also an Edition field and a Season field, so if we create a calculated column in each of those tables that combines the Edition and Season fields, we can establish a relationship between Hosts and Medals. The following screen shows the Hosts table, with its Edition and Season fields selected
ExcelData-9

Select the Hosts table in Power Pivot. Adjacent to the existing columns is an empty column titled Add Column. Power Pivot provides that column as a placeholder. There are many ways to add a new column to a table in Power Pivot, one of which is to simply select the empty column that has the title Add Column.

In the formula bar, type the following DAX formula. The CONCATENATE function combines two or more fields into one. As you type, AutoComplete helps you type the fully qualified names of columns and tables, and lists the functions that are available. Use tab to select AutoComplete suggestions. You can also just click the column while typing your formula, and Power Pivot inserts the column name into your formula.

=CONCATENATE([Edition],[Season])

When you finish building the formula, press Enter to accept it.

Values are populated for all the rows in the calculated column. If you scroll down through the table, you see that each row is unique – so we’ve successfully created a field that uniquely identifies each row in the Hosts table. Such fields are called a primary key.

Let’s rename the calculated column to EditionID. You can rename any column by double-clicking it, or by right-clicking the column and choosing Rename Column. When completed, the Hosts table in Power Pivot looks like the following screen.
ExcelData-10

Next let’s create a calculated column in Medals that matches the format of the EditionID column we created in Hosts, so we can create a relationship between them.

When you created a new column, Power Pivot added another placeholder column called Add Column. Next we want to create the EditionID calculated column, so select Add Column. In the formula bar, type the following DAX formula and press Enter.

=CONCATENATE([Year],[Season])

Rename the column by double-clicking CalculatedColumn1 and typing EditionID.
ExcelData-11

Next let’s use the calculated columns we created to establish a relationship between Hosts and Medals.

In the Power Pivot window, select Home > View > Diagram View from the ribbon.

Drag the EditionID column in Medals to the EditionID column in Hosts. Power Pivot creates a relationship between the tables based on the EditionID column, and draws a line between the two columns, indicating the relationship.
ExcelData-12

Now you can see the relationship between Host & Medal table is established on calculated field EditionID in both the tables.

Stay tuned for more details on this topic. I will come up with next step in this series in my upcoming post.

Till then keep learning & practicing.

Data Model, Development Tips, Excel, How To, PowerPivot, Report

Add a relationship using Diagram View in Power Pivot

Open the Workbook which we prepared in the last exercise in our previous post.

Add Excel Sheet/Table to the PowerPivot Data Model

  • In the Power Pivot window, in the View section, click Diagram View.
  • Use the slide bar to resize the diagram so that you can see all objects in the diagram. Rearrange the tables by dragging their title bar, so they’re visible and positioned next to one another. Notice that all tables are unrelated to each other, we will create relationship among these tables.

After adding relationship the Diagram will Look as below.

ExcelData-6

  • Let start creating the relationship.
  • Sports->SportID click and drag to Disciplines->SportID and release. You will see the relation is built between these two tables on SportID.

Similarly follow to create other relations too as shown in below image.
ExcelData-5

You notice that both the Medals table and the Events table have a field called DisciplineEvent. Upon further inspection, you determine that the DisciplineEvent field in the Events table consists of unique, non-repeated values.

The DisciplineEvent field represents a unique combination of each Discipline and Event. In the Medals table, however, the DisciplineEvent field repeats many times. That makes sense, because each Discipline+Event combination results in three awarded medals (gold, silver, bronze), which are awarded for each Olympics Edition the Event is held. So the relationship between those tables is one (one unique Discipline+Event entry in the Disciplines table) to many (multiple entries for each Discipline+Event value).

  • Create a relationship between the Medals table and the Events table. While in Diagram View, drag the DisciplineEvent field from the Events table to the DisciplineEvent field in Medals. A line appears between them, indicating a relationship has been established.
  • Click the line that connects Events and Medals. The highlighted fields define the relationship, as shown in the above screen.
  • To connect Hosts to the Data Model, we need a field with values that uniquely identify each row in the Hosts table. Then we can search our Data Model to see if that same data exists in another table. Looking in Diagram View doesn’t allow us to do this. With Hosts selected, switch back to Data View.
  • After examining the columns, we realize that Hosts doesn’t have a column of unique values. (Assume EditionID Field is not available in the Host & Medal Table, in my case I have already added this Field in my workbook I shared). In such case we’ll have to create it using a calculated column, and Data Analysis Expressions (DAX).

It’s nice when the data in your Data Model has all the fields necessary to create relationships, and mash up data to visualize in Power View or PivotTables. But tables aren’t always so cooperative, so the next post will describe how to create a new column, using DAX that can be used to create a relationship between tables.

We will see how to work with calculated fields in our next upcoming post.

Data Model, Development Tips, Excel, PowerPivot

Import data using copy and paste from Excel sheet or other source for PowerPivot Data Model.

You can copy & Paste data from an Excel workbook, or import data from a table on a web page, or any other source from which we can copy and paste into Excel. In the following steps, you add the data from a table.

  • Insert a new Excel worksheet, and give it the name desired any meaningful name that describes the data.
  • Select and copy the data, including the table headers.
  • In Excel, place your cursor in cell A1 of the above created worksheet and paste the data.
  • Format the data as a table. You press Ctrl + T to format the data as a table, or from HOME > Format as Table. Since the data has headers, select My table has headers in the Create Table window that appears.

ExcelData-1

  • Name the table. In TABLE TOOLS > DESIGN > Properties locate the Table Name field, and type desired name.

ExcelData-2

  • Format your data using Excel std. formatting tool.
  • Save the workbook.This file have couple of sheets having data related to Olympics which I have compiled from MS Office support site.
  • You can find the link on the Menu of my blogsite too to access the shared files.
  • I have create a sample Excel File for you which you can down load from the Shared Path using link: http://1drv.ms/1GpZFd4

I will be using this file for couple of walkthrough in my upcoming posts.

Development Tips, Excel, How To, Office Integration, PowerPivot, Report

Creating My First Report using PowerPivot

In my earlier posts we have created the Data model for Analysis.

If you missed them you can follow below links to refresh all information.

PowerPivot for Excel

PowerPivot Creating a Data Model in Excel 2013

Adding more tables to the Data Model using Existing Connection – In PowerPivot

Add relationships to Data Model in PowerPivot

How to add Filter for data retrieval in PowerPivot Data model.

Create a calculated column in PowerPivot

We have learned basic actions, let’s create our first Report.

I will be creating Pivot Matrix Customer Vs Item Sales.

Open the Excel in which we created our Data model and imported our table data.
PowerPivot-21
Select PivotTable From Ribbon under Home Tab.
PowerPivot-22

Select New Worksheet or Existing Worksheet as per the case.
PowerPivot-23
You will see a Pivot is inserted, in right side you will find all the tables available in the Data model of this Worksheet.
PowerPivot-24

Design the Pivot as above screenshot.
The output of this report will be as below if executed without Date Filter.
PowerPivot-25
I will come up with more details and features of PowerPivot in my upcoming posts. Till then keep practicing and stay tuned for more details on this topic.