Convert to PDF, Development Tips, Excel, How To, Information, Office Integration, Tip & Tricks, Word

Appending other information to Navision Reports

There is always requirement from many customers to Append information to the Navision Reports.

Recently one of my reader have requested me for any such functionality which can help him Append information from Word or Excel Files to Navision Reports.

While searching for solution for such requirement i came across this scope if we can do the same from outside Navision integrating the functionality with Navision.

Although i am not sure how much this post will answere to the requirement raised by my this reader but still this can be an work around to this requirement.

In my previous 2 posts i have answered this approach, Let us assemble all of them to provide solution to this requirement.

Please see my privious posts, i will not repeat already covered part in this post. Here is the link to those posts:

Converting Office Files into PDF from Navision

Merging PDF Files in Navision

In this post i will be using these functions discussed in above posts.

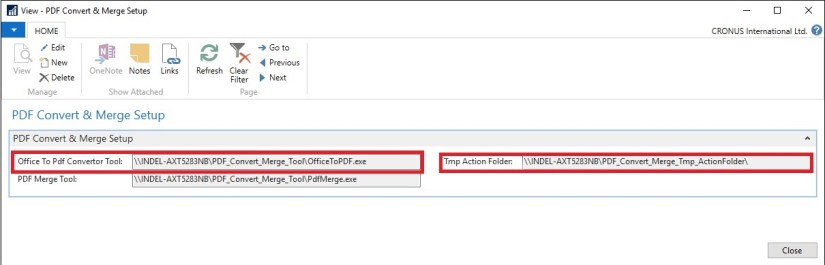
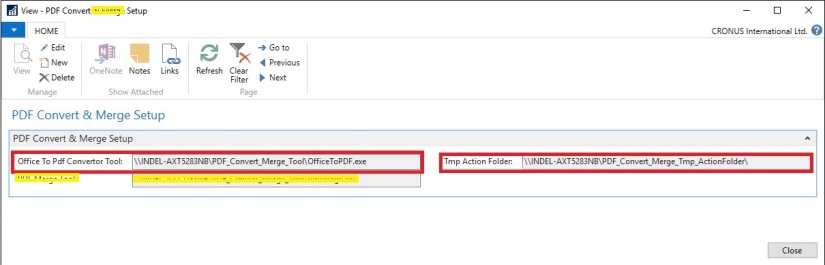
The Same Setup will be applicable to this post too.

PDFConvMerge-2-2

Since we are appending our other information to the Navision Report so we will be at First Step saving our Customer Sales Invoice to PDF.

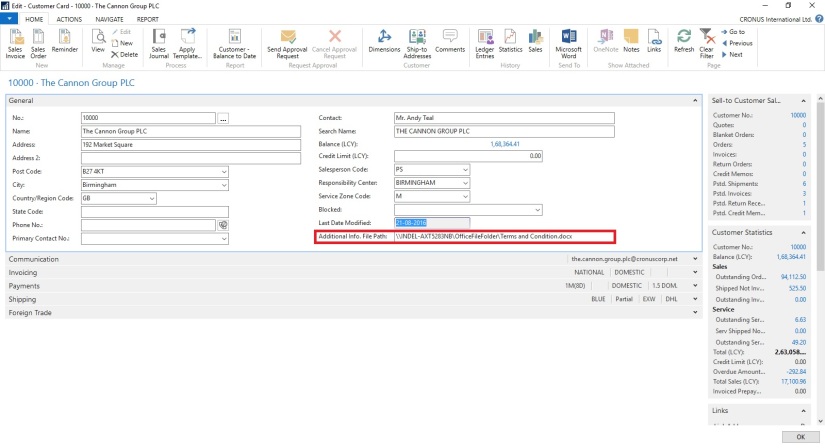
Later some information which need to be appended to this report is in Word File the path of which is stored on Customer Card.

How to work with Converting Office file to PDF is already discussed in previous post Link shared above.

So Now we have Our Report in PDF and Additional information to be appended to Report is also in PDF. Now it will be easy for us to Merge both the File to have single PDF File.

How to Merge these files is also already discussed in my previous post. Link shared above.

Let us see how we can assemble above both functionality to get our required result.

Approach is very simple, i have created a button on Sales Invoice to Print the Report which performs above discussed process.

PDFConvMerge-5

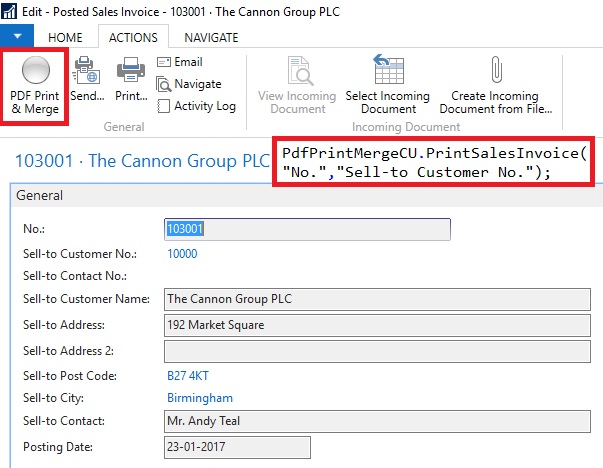
On Sales Invoice Page I have added one Button which calls my Function to Print & Merge the document, it takes Invoice No & Sell-to Customer No. as a parameter.

PDFConvMerge-6

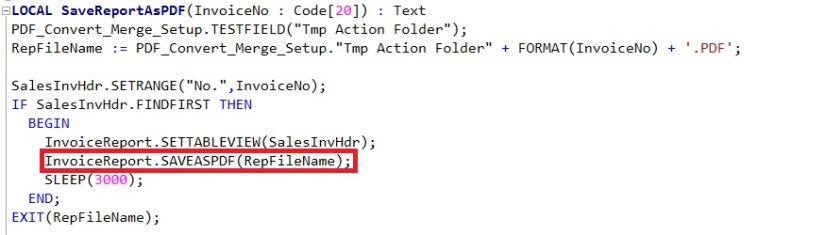
I have created a function to Save the output of Report to PDF, using standard functionality available in Navision.

PDFConvMerge-7

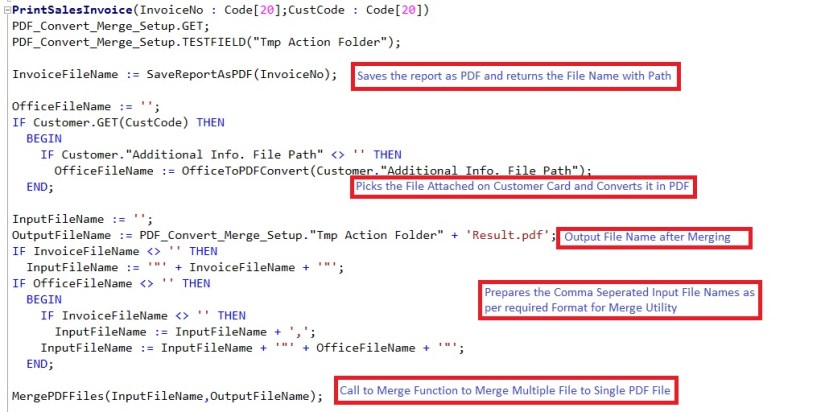
The PrintSalesInvoice function called from Sales Invoice Page with Invoice No & Sell-to Customer No.

This Function calls the SaveReportAsPDF explained above.

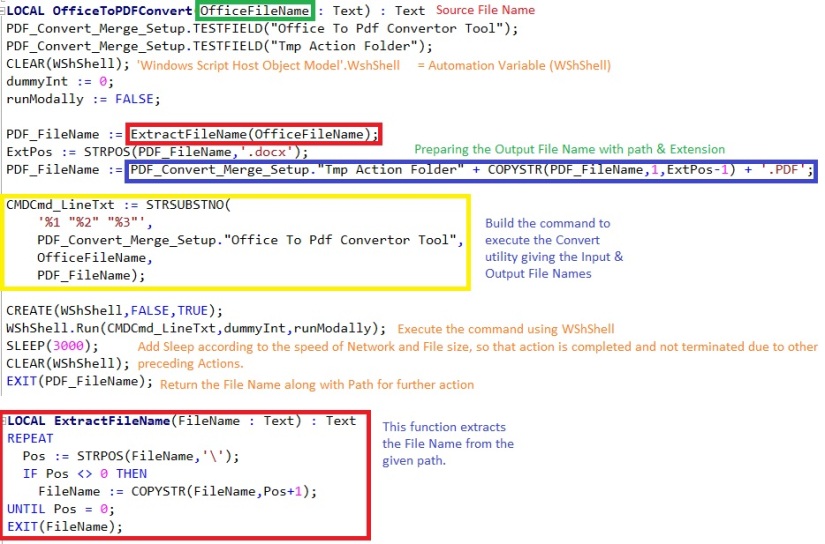
Converts the Office file that is attached on Custommer Card, discussed in previous post Link provided above.

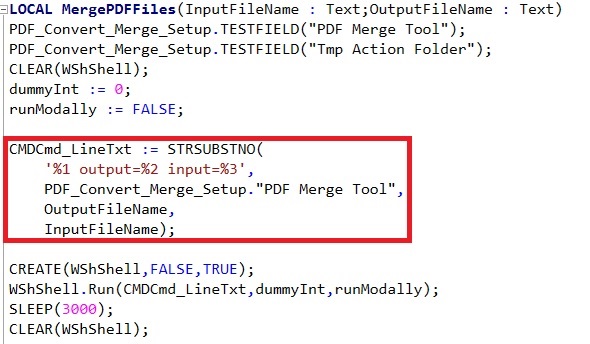
Calls the MergePDFFiles, discussed in previous post Link provided above.

So Now at single click of Button entire task is done for us.

To keep it simple no additional checks and other routine tasks have been included like after task is completed clean up of all temporary files and moving the Result file to desired Location etc.

Now you know the logic so you can tweak the code accordingly to get the functionality working as per your requirement.

Thats all for this post. I will come up with more information in my up coming posts.

You keep you requirements posting to me, i will try my best to answer your queries in form of my future posts, at earliest possible from my end.

Till then kee exploring & Learning.

Convert to PDF, Development Tips, How To, Information, Tip & Tricks

Merging PDF Files in Navision

Many of time we have multiple files in pdf but for some certain reasons we require to merge them to single File.

Continuing from my previous post i am extending my functionality with Merging of Mulitiple pdf files to single pdf file.

PDFConvMerge-2-2

In my Setup Page created in previous post i have added one more field to store the Tool Path & File Name for Merging multiple files.

Based on the dll provided by http://www.pdfsharp.net this post is written.

Visit the Site download the utility and extract the dll file and exe file from the zip and store in same Folder.

The format of command to merge the files at command prompt is similar to:

Command to merge :- pdfmerge output=.\ActionFolder\result.pdf input=.\ActionFolder\1.pdf,.\ActionFolder\2.pdf,.\ActionFolder\3.pdf

We will prepare the Function which will take as parameter the Output & Input File and run the utility to Merge these files to single file using WsShell in Navision.

PDFConvMerge-4

Function is very simple to accept the Input & Output File Names and Prepare Single PDF file from multiple pdf files provided as input (comma seperated List of Files) to the function.

To keep it simple no additional codes for test and other routine job is not added. Now you are familiar with the functionality you can tweak the code accordingly to meet all other requirements.

Thats all for this post. Will comeup with more Information in my upcoming posts.

Till then keep exploring and learning.


Convert to PDF, Development Tips, How To, Information, Office Integration, Tip & Tricks, Word

Converting Office Files into PDF from Navision

Today in this post i will walkthrough how we can convert any MS Office File into PDF.

It have been many time required to convert any attached file with the record in Navision to PDF format.

To perform this action we will require a tool which can be downloaded from:

OfficeToPDF download link :- http://officetopdf.codeplex.com/releases/view/118190

Extract and save the OfficeToPDF.exe file to some Folder.

For this Walkthrough i have created a Field in Customer Table to save the File Path of the Office File which we want to convert into PDF.

PDFConvMerge-1

You can add Dialog box to select the File from the specified Folder.

For this demo i have kept it simple Text Field where you can add your File Path and Office File Name. It is assumed that only Office File will be attached here.

For Setup purpose i have created one Setup Table & Page where we will store our other required Folder paths.

PDFConvMerge-2

Here we have given provision to save the Path of the Office to PDF Convertor Tool file Path & Temporay working Folder.

I have used the shared folder for all the paths so that it is not system specific, also make sure you give required permission on this folder for all the operating accounts.

Now our Next task will be to write a function which will perform this conversion part.

PDFConvMerge-3

Above Function Takes the File Name from the Customer Card we stored above on Customer Card. Takes the Path of the Office To PDF Convertor Utility and Tmp working Folder.

Prepares the PDF file Name along with Path stored in Setup.

Prepares the command to invoke Convert Utility using WsShell and returns the PDF file File Name along with path as defined in the Setup.

Now you can use this File for futher purpose as required.

To keep it simple no additional code of test and other required routine task is not added.

Now you know the Logic you can tweak the functionality as per your requirement.

I will comeup with more information in my up comming posts, till then keep exploring and learning.


Corfu Navision 2016, Development Tips, How To, Information, Report, Tip & Tricks

Controlling User wise Report Print & Save As… Permission


It is always asked from several users to have a control on Printing of reports from Preview.

Normally you have two options to print the Report in Navision.

  • From Request Page

PrintPreview1

  • From Print Preview

PrintPreview2

If you check document Reports you will notice that you don’t have option to Print the Report from Preview, but you can print from Request Page.

Why it doesn’t allow in such Reports?

It is because these report uses statement like:

IF NOT CurrReport.PREVIEW THEN

If the C/AL code for the report uses the PREVIEW function to disable printing from the preview, then users cannot change the display mode to print layout.

Using these option I have tried to disable Printing of Report from Request Page and Print Preview.

PrintPreview3


Add a Boolean type Field in User Setup Table & Page as shown above.

Now the report which we want to restrict from printing we will add piece of code.

Although there are other ways to do this but to keep it simple I have followed this approach. Once you are ok with logic you can implement the same in your way, in fact more better way than this sample demo.

PrintPreview4

If I run the report by setting Allow Report Printing to FALSE, it will not show me the Print & Save as Option on Preview.

PrintPreview5

Also if I Try to Print or Save As… from Request Page it will Flag me an error as above.

So now you know the logic behind it, what you are waiting for. Give your user to control the Printing & Save As… option.

Now in last Cumulative Updates also Microsoft added option to control this,  but it is at Service Level, if you want to control at user Level this is one option, wait for any further Cumulative Update in which Microsoft may add this capability or explore and find any other option and share with others.

That’s all for this post. I will come up with more details in my upcoming posts.

Till then keep exploring & learning.


Data, Development Tips, How To, Information, PowerBI.com, Tip & Tricks

App for Power BI REST APIs for Streaming Data

In this post we will see how to create app to use the Power BI REST APIs for Streaming Data.

Full documentation: https://powerbi.microsoft.com/documentation/powerbi-service-real-time-streaming/

To run this app follow the steps discussed in my previous post: [Real-Time Dashboard Tile & Streaming Dataset– in Power BI]

Summary as below:

  1. Go to app.powerbi.com
  2. Go to streaming data management page by via new dashboard > Add tile > Custom Streaming Data > manage data
  3. Click “Add streaming dataset”
  4. Select API, then Next, and give your streaming dataset a name
  5. Add a field with name “Customer ID”, type Number
  6. Add a field with name “Customer Name”, type Text
  7. Add a field with name “Sales Value”, type Number
  8. Click “Create”
  9. Copy the “push URL” and paste it as the value of “realTimePushURL” in below app

We will start with new project in Visual Studio.

RealTimeSync-12

Create a new Visual C# Console Application.

Open the Program.cs File and write a code as shown below.

This app Uses the WebRequest sample code as documented here: https://msdn.microsoft.com/en-us/library/debx8sh9(v=vs.110).aspx

RealTimeSync-13

For your easy here is the code of Program.cs below:


using System;

using System.Collections.Generic;

using System.Linq;

using System.Text;

using System.Threading.Tasks;

using System.Net;

using System.IO;


namespace RealTimeStreaming

{

class Program

{

// Paste your own push URL below as obtained from while creating Streaming Dataset and saved in step 9 above

private static string realTimePushURL = “https://api.powerbi.com/beta/4e7ca966-123e-4ce7-9833-3e858854b98f/datasets/7d154cd7-11e0-4d5e-9569-12fa3f82f224/rows?key=mD1nkJOf426PjPPaEQsW9xEg%2FN1EENQ2hRZvXIpHr%2BTXNk3XQpKsR2Jbe5CATiMoLmxjlzSp%2FIMlbe9HL8G4xQ%3D%3D”;

static void Main(string[] args)

{

while (true) { //Set Infinite Loop

try

{

// Declare values that we will be sending

Random r = new Random();

int currentValue = r.Next(0, 100);

String Name = “Dummy Name”;

// Send POST request to the push URL

WebRequest request = WebRequest.Create(realTimePushURL);

request.Method = “POST”;


//Here you will retrieve the data from the source and format as per the request.

//In this example we are sending Random Value generated by above code for testing purpose.

string postData = String.Format(“[{{ \”Customer ID\”: {0}, \”Sales Value\”:{1} }}]”, currentValue,currentValue);

Console.WriteLine(String.Format(“Making POST request with data: {0}”, postData));


// Prepare request for sending

byte[] byteArray = Encoding.UTF8.GetBytes(postData);

request.ContentLength = byteArray.Length;

// Get the request stream.

Stream dataStream = request.GetRequestStream();

// Write the data to the request stream.

dataStream.Write(byteArray, 0, byteArray.Length);

// Close the Stream object.

dataStream.Close();

// Get the response.

WebResponse response = request.GetResponse();

// Display the status.

Console.WriteLine(String.Format(“Service response: {0}”, ((HttpWebResponse)response).StatusCode));

// Get the stream containing content returned by the server.

dataStream = response.GetResponseStream();

// Open the stream using a StreamReader for easy access.

StreamReader reader = new StreamReader(dataStream);

// Read the content.

string responseFromServer = reader.ReadToEnd();

// Display the content.

Console.WriteLine(responseFromServer);

// Clean up the streams.

reader.Close();

dataStream.Close();

response.Close();

}

catch (Exception ex)

{

Console.WriteLine(ex);

}

// Wait 5 second before sending

System.Threading.Thread.Sleep(5000);

} //Infinite Loop ends here.

}

}

}

Compile and Run the Program.

RealTimeSync-14

Leave the Program Running and switch to Power BI dashboard. You will see your newly created Tile in previous post will be displaying the Random Value generated by this program updating every 5 seconds.

That’s all with little tweaking to this program you can fetch your data and send the updated data to your Real Time Streaming Dataset.

That’s end to this post.

I will come up with more details in my upcoming posts.

Till then keep Exploring and learning.


Data, Data Model, Development Tips, How To, Information, PowerBI.com, Tip & Tricks

Real-Time Dashboard Tile & Streaming Dataset– in Power BI

Power BI have introduced real-time dashboard tiles – a lightweight, simple way to get real-time data onto your dashboard. Real-time tiles can be created in minutes by pushing data to the Power BI REST APIs or from streams you’ve created in Azure Stream Analytics or PubNub, a popular real-time streaming service. Let’s see how we can do in no time.

Login to your Power BI using your credentials.

Go to your dashboard where you wish to add Real Time Streaming Tile, choose “Add a tile”

RealTimeSync-1

Select the “Custom streaming data” option

RealTimeSync-2

Click on Next.

RealTimeSync-3

At first usage you may not be having Streaming Dataset, if you have List will be shown.

Let’s create one for our Example, Click the link – Manage Data.

RealTimeSync-4

Click on Add Streaming Dataset.

RealTimeSync-5

From New Streaming Dataset, Select API and click on Next.

RealTimeSync-6

Add your Dataset Name, Fields and Datatypes.

Once you are done, Click on Create.

RealTimeSync-7

Copy your Push URL, we will require this to push data to Data Stream.

Click On Done.

RealTimeSync-8

Returning to our Previous Step, Now we can see Streaming Dataset Available.

Select your Dataset and Click on Next.

RealTimeSync-9

Select the Type of Visualization you want, and Fields to display.

Click on Next.

RealTimeSync-10

Give Title, Subtitle to your Tile and click on Apply.

RealTimeSync-11

Bravo, you are done, your Tile will be added on your Dashboard.

But hold on, the Value will not come until you add logic to push data to the Tile.

Now we will move to our Next Step, where we will create a program to call Power BI REST API and push Streaming data to our Dashboard. Checkout my next post for same. [App for Power BI REST APIs for Streaming Data]

Till then keep Exploring & Learning. I will return soon with my next post.


Data, How To, Information, Tip & Tricks, What's New

Save General Journals as Standard Journal in Navision

Do you Know you can save the General Journal as Standard Journal and retrive edit and post it later.

Many of time we pass entries of same Nature, Like Rent, Salary, Bills etc.. just an example you can decide upon which entries you post frequently and club it as Standard Journal to save your time.

You can create once and retrive it every month or when ever required and Post it in future/later.This can serve you as template for future use.

Let us see how we can use this feature.

StdGen-1

Open your General Journal.

Make entries which you do oftenly. Don’t put Postng Date & Document No. Complete your all entries.

Next we will save this as Standard Journal for future use.

From Action choose Save as Standard Journal.

StdGen-2

Give Code & Name for your Journal Template.

If Amounts are fixed every time you can enter them too and while Save choose Save Amount.

No Let us review the entry that we saved.

From Action Choose Get Standard Journal.

This will display you all Saved Standard General Journals.

StdGen-3

Select the required Journal Code and Click on Edit.

StdGen-4

This is what is Saved in your Standard Journal.

Let use return to the Standard Journal List.

Select desired/ earlier saved Std. Journal and Click on OK.

StdGen-5

Confirmation of Std. Journal retrived and Journals created in General Journal Page.

StdGen-6

Your General Journal gets populated with values you saved to Std. Journal.

Have you Noticed, Posting Date as your Work Date and Next Document No. from your assigned No. Series is populated Automatically.

StdGen-7

Fill the Amount and any other required fields and Post the Journal.

Next time when again you wish to post similar entries just retrive it and continue.

Thats all for todays Post, What you are waiting for give it a try.

I will comeup with more details in my upcoming Posts, till then keep exploring and Learning.


Data, Development Tips, How To, Information, Tip & Tricks

Creating Views – to Save Filtered Lists in NAV

Do you Know you can save the Page as View with filters.

Many of time we access to Page and apply same set of Filters to fetch our data. You can save the same for quick retrival of data applying the filters automatically in future access.

You save the Page with Filters as View.

Let us see small example how to achieve it.

First we will open the List Page in my case i am having one customized Customer List.

FilteredView-1

Suppose this is the Page which i use for Balances Retrival each month and on daily basis.

I Enter Filter as Balance > 5000 & Current Month Filter whenever i wish to check balances for my reporting or followup purpose.

For Date Filter i use (-CM..CM) sothat when i open this view next month it takes the appropriate Filter for that month.

FilteredView-2

Click on the Page Name post applying all the required Filters.

Select Save View as.

Give the Name for the View.

Select the Location to save the View.

On Confirmation respond as Yes.

FilteredView-3

Your View will be Saved, You can create as much Views as desired using different Filters.

FilteredView-4

Small and good Feature.

What you are waiting for give it a try.

I will comeup with more information in my upcoming posts, till then keep exploring and learning.


Azure, Corfu Navision 2016, How To, Information, Instalation & Configuration, Office 365, Office Integration, Tip & Tricks

Configuring Single Sign-On using Office 365 on Navision 2016

Today we will see how we can enable Single Sign-On using Office 365 for Navision 2016.

Before we start we should have Virtual Machine ready on Azure with Navision 2016 installed, Certificates and Nav User is configured. Endpoints are open so that web client can be used from outside Virtual Machine on internet.

It should be hosted on Public IP, then only we will be able to configure it.

For details regarding Azure Subscription you can see my earlier post here.

For details regarding Creating Virtual Machines you can see my earlier post here.

You also need Office 365 Subscription ready for use and you can use the AD of same to configure your Single Sign-On.

Let us start with Admin console of office 365. Click on Azure AD this will create Management Console to work with AD.

SingleSignOn-1

Enter your details and click on Next.

SingleSignOn-2

Enter your details and click on Next, Finally Sign Up.

SingleSignOn-3

It will take few minutes to configure and make it available for you.

SingleSignOn-4

Once your Subscription is ready click on Start Managing my Service.

SingleSignOn-5

From Management Console click on Virtual Machine, if you dont have already to create one for you.

SingleSignOn-6

Select the Virtual Machine in Search for Microsoft Dynamics Nav 2016.

SingleSignOn-7

Select the approprite Virtual Machine from the List.

SingleSignOn-8

Enter your details and Create. For more details see the link provided on top of the post.

SingleSignOn-9

Let us return to our AD, Click on Applications. This will List all you Apps currently available with your AD or office 365.

SingleSignOn-10

Click on Add to configure your Application.

Give a Name and Select Web Application/or Web API, as we are configuring for Web Client today. Click on Next.

SingleSignOn-11

Enter your Web Client URL and Office portal AD URL.  Click on OK.

SingleSignOn-12

Your New application gets registered with your AD.

Select the created Application and Click on View Endpoints.

SingleSignOn-13

Copy the Federation MetaData URL and keep it handy at safe place we will require this in our next step. Close the window we are not performing any changes here.

SingleSignOn-14

Open your Navision User Card.In Office 365 Authentication enter your Office portal user email id which you will be using for Single Sign-On.

SingleSignOn-15

Open your Navision Service Instance configuration and enter Federal MetaData URL which we copied in our previous step.

SingleSignOn-16

Restart you NAV Service.

SingleSignOn-17

Open the Web Client Folder under your IIS. Edit your Web.config file using prefered Editor.

SingleSignOn-18

Enter you Client Service Credentials as AccessControlService.

SingleSignOn-19

Change value of ACS URI as below. You have full explaination of same in the file itself.

SingleSignOn-20

Thats all, Now you open your web client and you will be redirected to Office 365 Login Page, enter your valid office 365 e-mail user id and password you will be authenticated and Web Client is opened.

Thats all for today, I will come up with moredetails in my upcoming posts.

Till then keep exploring and learning.


Alert, Development Tips, How To, Information, PowerBI.com, Tip & Tricks

Working with Alerts in Power BI

Knowing about changes to important metrics quickly some time can help you taking quick decisions or help you keep eyes on things you care most.

With data driven alerts in Power BI, you can now get notifications when a metric you care about on your dashboard exceeds a set threshold.

Alert notifications will be sent to you as an email, and appear in your notification center on the web and in mobile apps.

You can set alerts for your numeric tiles featuring cards and gauges only. You have control over how often you want to be notified about your data, and whether you want to receive an email when your data goes beyond the limits you set.

Only you can see the alerts you set, even if you share your dashboard.

Alerts only work on data that is refreshed. When data refreshes, Power BI looks to see if an alert is set for that data. If the data has reached an alert threshold, an alert is triggered.

Alerts only work with numeric data types.

Alerts only work on data that is refreshed. They do not work on static data.

Today we will see how to work with Alert feature in Power BI.

Login to your Power BI using your credentials.

Switch to your Dashboard.

I have one ready to use dashboard from my previous post to show Alert feature I am using the same.

As discussed above it works only for Numeric & Gauges Tiles only, for others you will not get even the Alert option.

Luckily I have one on my Dashboard, if want to learn how to create Numeric Tiles or more details on working with Power BI you can refer to any of my previous posts on Power BI. However you can find here one direct Link to the topic in question.

You see I have selected my Numeric Tile in below screen shot.

DataAlert-1

How to Set Data Alerts:

From a dashboard tile, select the ellipses.

Select the bell icon  to add one or more alerts.

DataAlert-2

Click on Add Alert Rule.

To start, ensure the Active slider is set to ON, and give your alert a title.

DataAlert-3


Set your Condition, Threshold, and Notification Frequency also don’t forget to tick on send me mail too.

Click on Save to save your Alert.


Receiving alerts:

When the data being tracked reaches one of the thresholds you’ve set, several things will happen.

Power BI checks to see if time have lapsed or more than depending on the option you selected since the last alert was sent.

As long as the data is past the threshold, you’ll get an alert every hour or every 24 hours depending on option you selected.

If you’ve set the alert to send you an email, you’ll find something like as shown in below screen, this in your Inbox.


DataAlert-4


Power BI will add a message to your Notification center and adds a new alert icon to the applicable tile as shown in below screen.

DataAlert-5


Access to your Notification.

DataAlert-6


Manage alerts:

There are three ways to manage your alerts:

From the dashboard tile

From the Power BI Settings menu

On an individual tile in the Mobile App

DataAlert-7


As we have seen above how to create Alerts follow same steps to access Alert Window.

At the Left click on Expand make Necessary Modifications and save.

At the right select the trashcan to delete the Alert.

Select cancel to return to previous window.


DataAlert-8

From here you can turn alerts on and off, open the Manage alerts window to make changes, or delete the alert.


That’s all for today.

I will come up with more details in my upcoming posts.

Till then keep exploring and learning.