Development Tips, Excel, How To, Jet Reports, Office Integration, Report

Using Link in Jet Reports

LINK gives users advanced filtering capabilities in Jet Essentials.

Using LINK allows users to tie together information from different tables.

LINK is available for all connector types.

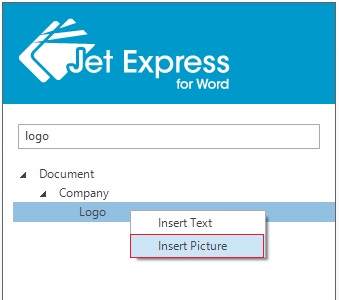
Recall from my previous post where I introduced with NL Function, you can find the Link here.

Since Link is used in Combination with NL Function so recalling it is necessary here, if you have not seen the previous post please follow the link above to understand the functionality, before you continue.

Let’s start with simple NL Function usage, later we will see its usage with Link.

The following formula will return the document number for each Sales Invoice Header in the system.

=NL(“Rows”,”Sales Invoice Header”,”No.”)

The following formula will return only sales invoices where the posting date is within a specific data range.

=NL(“Rows”,”Sales Invoice Header”,”No.”,”Posting Date”,”>1/1/2009″

LINK can be used to filter on a field that is not in the Sales Invoice Header table (such as the “Type” field in the Sales Invoice Line table) as follows:

=NL(“Rows”,”Sales Invoice Header”,”No.”,”Posting Date”,”>1/1/2009″,”LINK=”,”Sales Invoice Line”,”Document No.”,”=No.”,”Type”,”Item”)

UsingLink-1

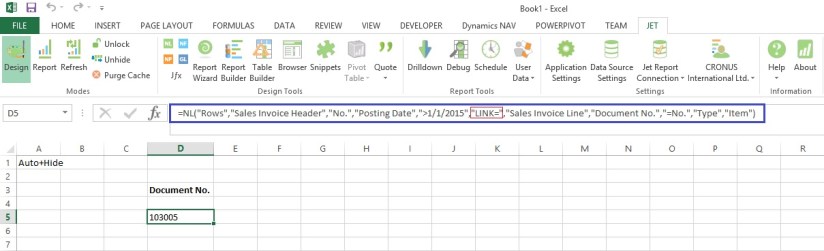
In this example, we used LINK= and specified the Sales Invoice Line table because this is where the “Type” field that we want to filter exists. We linked to the Sales Invoice Header by specifying that the “Document No.” Field on the Sales Invoice Line matches the “No.” field on the Sales Invoice Header.

We then specified the “Type” filter on the Sales Invoice Line table.

Please note that some relationships between tables may require more than a single field to define the link:

=NL(“Rows”,”Purch. Rcpt. Line”,,”Link=”,”Purch. Inv. Line”,”Document No.”,”=Order No.”,”Line No.”,”=Order Line No.”,”Posting Date”,”>1/1/2010″)

Nested Linking

LINK statements can be combined to fulfil more complex filtering requirements.

For example, assume that you would like to see the territories with sales during a given period.

A simple formula could be used if the territory is available on the table that contains the historical sales information and if you wanted the territory assignment at the time that the sale was made.

If, on the other hand, the territory is not available, or you want the currently assigned territory, you can do this by combining LINK statements as follows:

=NL(“rows”,”Country/Region”,”Code”,”Link=”,”Customer”,”country/Region Code”,”= Code”,”Link=”,”Sales Invoice Header”,”Sell-to Customer No.”,”=No.”,”Posting Date”,”>1/1/2010″)

In this example we linked the Country/Region to the Customer and the Customer to the Sales Invoice Header. Then we filtered by the “Posting Date” field to get Country/Region with sales for a specific period.

Linking Multiple Tables

LINK statements can also be combined to handle situations where a single table is linked to multiple tables.

For example, want to see Sales Invoices where the Country/Region Code is “AE” and the Vendor is “30000”.

To do this we can link from the Sales Invoice Line table to the Customer table with the “field filtered for “AE” and, in addition, link from the Sales Invoice Line table to the Item table with the “Vendor No. filtered for “30000”.

=NL(“Rows”,”Sales Invoice Line”,,”Type”,”Item”,”Link=”,”Customer”,”No.”,”=Sell-to Customer No.”,”Country/Region Code”,”=AE”,”Link=”,”Item”,”No.”,”=No.”,”Vendor No.”,30000)

Note that the Link statements include the primary table (Sales Invoice Line) which indicates that links should restart from the primary table rather than linking in the nested fashion demonstrated in the previous section. It is possible to mix these models and have multiple links as well as nested links.

One other thing to note is that filters applied to the primary table (like the filter on the “Type” field in this example) should occur before any LINK statements.

NL(“Link”)

The NL(Link) function can be used to specify linked tables when more than 10 parameters are needed for a linking statement.

This example formula was used in the nested link section and links from the Country/Region table to the Customer table and then from Customer table to the Sales Invoice Header table.

=NL(“Rows”,”Country/Region”,”Code”,”Link=”,”Customer”,”Country Region Code”,”=Code”,“Link=”,”Sales Invoice Header”,”Sell-to Customer No.”,”=No.”,”Posting Date”,”>1/1/2009”)

Enter in Excel Sheet Below Formula:

[Cell E4] =NL(“Rows”,”Country/Region”,”Code”,”Link=”,F4)

[Cell F4] =NL(“Link”,”Customer”,,”Country/Region Code”,”=Code”,”Link=”,G4)

[Cell G4] =NL(“Link”,”Sales Invoice Header”,,”Sell-to Customer No.”,”=No.”,”Posting Date”,”>1/1/2010″)

UsingLink-2

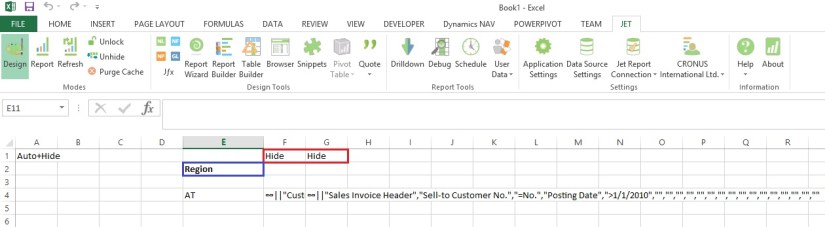
Explanation as below:

UsingLink-3

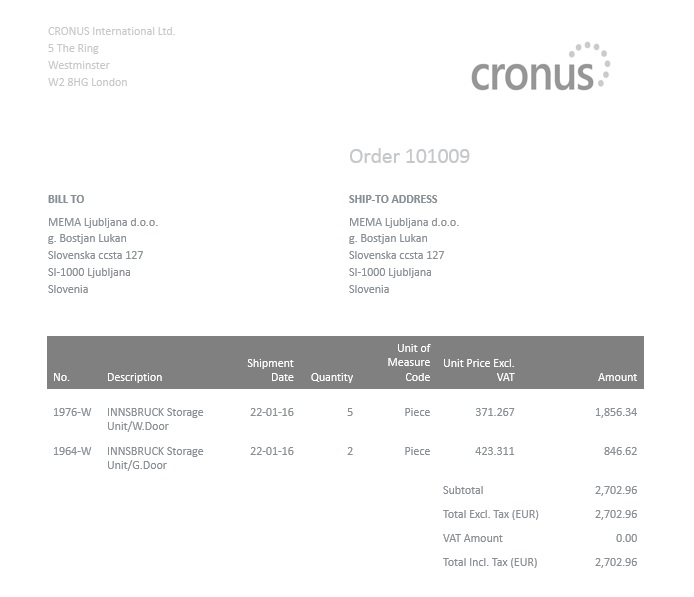
When we execute the Report Output will be as below:

UsingLink-4

Stay tuned for more details in my Upcoming posts.

Development Tips, Excel, How To, Jet Reports, Office Integration, Report

Using Jet Report NF Function

In my previous post I have explained usage of NL Function, if not seen please check this Link.

The NL function works great if you want a single field from a record, but if you want to retrieve more than one field from the same record, retyping all the filters for each field can be tedious.

The NF function is a shortcut that will return the value of a field in a record. One or more NF functions can be used with a single NL function that has the NL field parameter left blank.
NFFunction-1
NFFunction-2
Similarly we can enter Formula in other cells:
NFFunction-3
The output of Above Report will be as below:
NFFunction-4
You need to press Report or Refresh Button on the Ribbon to view the output of the Report.

If we see in above output column D is not having any valid information for reporting point of view so we can Hide them. Also Colum Headings will add more meaning full information. Let’s do some Formatting to the Report too.

To Return to Designer mode you need to press Design button on Ribbon.
NFFunction-5
The First Row & First Column is reserved for Jet Commands, so don’t use for your data purpose.

The A1 cell is auto populated when you run the Report First time.

The Hide in D1 instructs Jet to Hide this column at Report run.

E3 to G3 I have added the Column Heading for my Data. You can use any Formula or Formatting Supported in Excel.

E5 to G…. is the data area which retrieves the value from database using the Jet Functions.

Let’s See the output of above Report. Press Report or Refresh Button to view the output of the Report or execute the Report.
NFFunction-6
The Report & Refresh button is having different purpose:

Report: Retrieves data from catch, help full in testing report while Designing.

Refresh: Retrieves fresh data from the database, you will get updated data if any between earlier run.

If you closely monitor the Report you will find that the First Row/Column [1] and Column D is hidden from Report output.

If there is no primary key in the table, Jet Reports will give an error message if you leave the Field parameter of the NL blank so you can try leaving the Field blank, then fill in a list of field names if necessary.

See my upcoming posts for more details of NL & NF Functions with more usage.

Development Tips, Instalation & Configuration, Jet Reports, Office Integration, Report

Using the Jet Ribbon Jet Essentials 2015 Update 1 for Navision 2015

Jet ribbon in Excel has been modified to make it easier to use.
JetRibbon-1

Some items have been moved so as to provide better grouping of related items.  Other (less-common) items do not display by default.

Additionally, the Function Wizard (“Jfx”) has been replaced by four smaller icons…
JetRibbon-2

which allow you to easily select what type of Jet function you would like to place in your report.

You have a great deal of control over which items appear on the ribbon.  Simply go to the “Jet Ribbon” section of the Jet Essentials Application Settings..
JetRibbon-3

Place a check next to those items you do want on the ribbon and uncheck those that you do not want to see.

Checkout Upcoming posts for more information.

Development Tips, Jet Reports, Office Integration, Report

Customize the Report layout using Jet Express for Word

Click Edit Layout to customize this layout
JetReportDesign-1

The Jet Express for Word action panel may automatically open when this word file is opened.

If not, select the Jet Ribbon

Click on the Design icon

This presents a tree hierarchy of the fields from the selected report. 
JetReportDesign-2

Click on the icons on the hierarchy to expand or contract the lists.

The Search field makes it easy to find the fields you need.

Labels – NAV reports which were created by Jet Reports include a section for Labels. These fields are the descriptions of the fields themselves.

If you have multiple languages in your NAV instance, these labels can be helpful for creating multi-language documents.

Other Groupings – NAV reports which were created by Jet Reports include sections for Company, Customer, etc. These fields include the values of the fields.

The user can select from fields including Header or Lines in the hierarchy and insert an item, typically into a table in the Word document.
JetReportDesign-3

To add a field select the desired location in the Word document and double-click on the field.

Alternatively, you can select the field and click on the Insert button in the Jet Express for Word action panel.

To Add a picture to a document, right-click on the item and select Insert Picture
JetReportDesign-4

The Lines fields are also inserted as text and can be replicated by a Right-click, and choosing “Insert Repeater”.

Repeating items (such as Sales lines on a Sales order) can be added to a document.
JetReportDesign-5

Best practice for this is to create a table in Word that is two rows high.

The first row contains the Labels of the fields that you wish to include.

The second row contains the values of the fields.

Select the entire second row- include the area just to the right of the last column.

Right-click on the item in the hierarchy that you want to repeat and select Insert

To delete an item, click on it, and then click on its Title.
JetReportDesign-6
When you click on the Title it will change color.

Then press the Delete Button on your keyboard.

Note: It’s important to select the Title when deleting to avoid any leftover data.

When you have completed your changes Save your Word document
JetReportDesign-7
This will return you to NAV and prompt you to import the report layout changes.
JetReportDesign-8
Click Yes

You can Run Report to review your changes.
JetReportDesign-9
Here is the output for the report below.
JetReportDesign-10
We are done with customization of the report using Jet Reports.

I will come up with more details in my upcoming posts.

Development Tips

Using a FixedLayout Control

Arrange Page Fields in Rows and Columns Using a FixedLayout Control

A FixedLayout group control is typically used to display statistical data.

Fields in a FixedLayout group control are displayed in a FastTab with a heading for each row and column.

Previous versions of Microsoft Dynamics NAV supported having a FixedLayout control directly under a ContentArea. In Microsoft Dynamics NAV 2013 and later versions of Microsoft Dynamics NAV, you must make sure that the FixedLayout control is nested in a Group control.

To arrange page fields in rows and columns

  1. Open the page in Page Designer.
  2. In Page Designer, insert a blank line where you want to locate the fields.
  3. Set the Type and SubType field to Group. In the Caption field, type the text that you want as the heading of the FastTab that contains the fields.
  4. On the next line, set the Type to Group and SubType field to FixedLayout.
  5. On the next line, set the Type and SubType field to Group. This defines the placeholder for the first column of fields. To add a heading to the column, type the text in the Caption field.
  6. On the next line, set the Type to Field. This defines the first field in the column. In the Caption field, type the text that you want to use as the heading for the row.
  7. Specify the data source for the field by doing one of the following:
    • If the data source is a field of the table that is associated with the page, then on the View menu, choose Field Menu, select the field, and then choose the OK button.
    • If the data source is a variable, then on the View menu, choose C/AL Globals or C/AL Locals, and then create the variable. After you create the variable, in the SourceExpr field in Page Designer, choose the AssistEdit button and select the variable.
  8. Repeat steps 6 and 7 to add the remaining fields in the first column.
  9. Repeat steps 5 through 8 to add group controls that define the remaining columns.

You do not need to specify captions for these fields. Only the captions of fields in the first column define the row headings.

To demonstrate above steps, find below screen shots which makes you understand the concept easily.

FixedLayout-1

We will create V1..V9 variable as decimal.

We will create R1..R3 variables as Text.

Next we will design and group the page as below:

FixedLayout-2

When we save and run the page we will get below output.

FixedLayout-3

You can use table fields or calculated variables.

You can nest the Layout for different views.

Development Tips, Functional Tips, Tip & Tricks

Using of Posting Groups

Posting groups in Microsoft Dynamics NAV are very important part of configuration process. All G/L Entries depends of correctly configured posting groups.

We can find a lot of them: General Business and Product Posting Groups, VAT Business and Product Posting Groups, Customer and Vendor Posting Groups, Inventory Posting Groups…

Sometime, it is very confusing how it works, especially for unexperienced people.

You can find good explanation on same in this post by Totovic.

Nicely explained, you should see it here. I feel must to see this post for every Navision Consultants either fresher or experienced.

Development Tips, Excel, Office Integration, Report, Server

Viewing Page Data in Excel Using PowerPivot (OData)

Here I will discuss how you can use OData to expose a Microsoft Dynamics NAV 2015 page as a web service and then analyse the page data using Microsoft PowerPivot for Excel 2013.

With OData and PowerPivot, you gain access to a powerful set of tools and technologies for data exchange and analysis.

This walkthrough illustrates the following tasks:

  • Publishing a Microsoft Dynamics NAV page as a web service.
  • Verifying web service availability from a browser.
  • Using the PowerPivot add-in for Excel to import the table data as a new worksheet.
  • This procedure also includes optional instructions about how to use a web service access key.
  • Creating a PivotTable from the worksheet, selecting relevant fields, and then organizing and formatting the data to highlight strategic data.

Optional:

If you want to use a web service access key to authenticate access to the web service, Microsoft Dynamics NAV must meet the following requirements:

The Microsoft Dynamics NAV Server is configured to authenticate users by using the NavUserPassword credential type.

There is a Microsoft Dynamics NAV user account that has a web service access key.

You can find more details in my earlier post here

Publishing a Page as a Web Service

You can publish a web service by using the Microsoft Dynamics NAV Web client or the Microsoft Dynamics NAV Windows client.

To register and publish a page as a web service

  • Open the RoleTailored client and connect to the CRONUS International Ltd. company.
  • In the Search box, enter Web Services, and then choose the related link.
  • In the Web Services page, choose New.
  • In the Object Type column, select Page. In the Object ID column, enter 21, and in the Service Name column, enter Customer.

This exposes the Customer Card page as an OData web service.

  • Select the check box in the Published column.

Choose the OK button to close the New – Web Services page.

PowerPivot-1
Verifying the Web Service’s Availability

Security Note

After publishing a web service, verify that the port that web service applications will use to connect to your web service is open. The default port for OData web services is 7048. You can configure this value by using the Microsoft Dynamics NAV Server Administration Tool.

To verify availability of a Microsoft Dynamics NAV web service

Start Windows Internet Explorer.

In the Address field, enter a URI using the following format: http://Server : WebServicePort/ServerInstance/OData/

Server is the name of the computer that is running Microsoft Dynamics NAV Server.

WebServicePort is the port that OData is running on. The default port is 7048.

ServiceInstance is the name of the Microsoft Dynamics NAV Server instance for your solution. The default name is DynamicsNAV80.

For example, if the Microsoft Dynamics NAV Server is running on the computer that you are working on, you can use: http://localhost:7048/DynamicsNAV80/OData/

In my case: – http://indel-axt5283n1.tecturacorp.net:8048/DynamicsNAV80/OData/

The browser should now show the web service that you have published, as shown in the following illustration.

PowerPivot-2
Note

If the browser cannot find the web service, it may indicate that the specified Microsoft Dynamics NAV Server instance is not running.

Make Sure Enable OData Services is checked.
PowerPivot-3
Importing Microsoft Dynamics NAV Data into Excel

In the following procedures, you use PowerPivot to import Microsoft Dynamics NAV data into Excel. If you will be using a web service access key for authentication, only perform the second procedure; otherwise, only perform the first procedure.

To import Microsoft Dynamics NAV data into Excel

Start Microsoft Excel.

In Excel, on the PowerPivot tab, choose Manage.

PowerPivot-4
This opens the PowerPivot for Excel window.
PowerPivot-5
In PowerPivot, on the Home tab, choose Get External Data, choose From Data Service, and then choose From OData Data Feed.

The Table Import Wizard opens.

PowerPivot-6
If your Microsoft Dynamics NAV implementation requires that you use a web service access key, you must specify the NavUserPassword credentials as described in the following steps:

In the Advanced dialog box, in the Security section, set the Integrated Security field to Basic. If your OData is configured to use SSL, then set the field to SSPL.

In the Password field, type the web service access key.

In the UserID field, type the user name for the Microsoft Dynamics NAV user account. For this walkthrough, use NavTest.

In the Source section, in the Service Document URL field, type the URL for the OData web service that you verified in the previous procedure, for example, http://localhost:7048/DynamicsNAV80/OData/.

In my case: – http://indel-axt5283n1.tecturacorp.net:8048/DynamicsNAV80/OData/

Choose the OK button to return to the Table Import Wizard.

In the Connect to a Data Feed page, in the Data Feed Url field, enter the OData URI that you verified in the previous procedure.
PowerPivot-7

Choose the Next button.

Important: The URI must end with a slash (/) as shown in the example.

Verify that Customer appears in the Source Table column.

Select the check box next to the Customer web service, and then choose Finish.
PowerPivot-8
After you see the Success message, choose the Close button.
PowerPivot-9

The data from the Customer OData web service displays, and you can use the data to build pivot-based views in the Excel workbook.

Creating a PivotTable Containing Key Microsoft Dynamics NAV Data

In this procedure, you use the Excel workbook with data from the Customer web service to create a PivotTable from the worksheet. You select relevant fields and then organize and format the data to highlight strategic data. Building a pivot table is a way to select and arrange data so as to highlight and focus on key elements.

To create a PivotTable

In Excel, select the cell where you want the PivotTable located.

In the ribbon, choose the Insert tab, and then in the Tables group, choose PivotTable.

In the Create PivotTable dialog box, select Use an external data source, and then choose the Choose Connection button.

In the Existing Connections dialog box, on the Connections tab, under Connections in this Workbook, choose the data feed for your OData web service, and then choose the Open button.
PowerPivot-10

Choose the OK button to add the PivotTable to the Excel worksheet.

The PowerPivot Field pane on the right side includes a list of fields from the Customer web service that where imported from PowerPivot.

In the PowerPivot Field List pane, choose Location_Code.

Tip

To quickly find a field in the field list, type part or all of the field name in the Search text box that is above the list of fields, and then press Enter to highlight the first field that contains the text. You can then choose the right arrow to proceed to the next field, and so on.

Select the Balance_LCY field.

Select the Name field.

You can now see the data in the body of the worksheet, as shown in the following illustration.

The PivotTable shows customers by location and individual customer balances, and also adds the balances by location. To make the information more readable, you can update the headings on the PivotTable.
PowerPivot-11

Select the cell that has the heading Sum of Balance_LCY, and then, in the formula field, type Balance.

Select the cell that has the heading Row Labels, and then in the formula field, type Customers by location.

Select the empty cell that is below the Customers by location cell, and then, in the formula field, type Location not specified.

The above illustration shows how the worksheet looks after you make these changes.

Next Steps

Now that you have created your PivotTable, you can continue to enhance the data to make it more useful and readable. You can:

Add a column to the data that shows average balance by region.

Enhance data presentation with a graph.

Post the data in a Microsoft SharePoint environment with live data from Microsoft Dynamics NAV 2015.

Cues, Query

Using Query Object to Calculate the Cue Data

Today we will learn to create a query to update Cue data.
SI-Cue-1

Creating a Query for Calculating the Cue Data
First, we will create a query object to calculate the number of open sales invoices from table 21 Cust. Ledger Entry.
Create a query for calculating the Cue data as below:
SI-Cue-2
Save the query.

Adding the Table Field for the Cue Data
Next we will add a field to the table Sales Invoice Cue (create new table) for holding the Cue data.
SI-Cue-3

SI-Cue-4
We will add a global function that returns the total amount of sales invoices for the current month from the query object that we created above procedure.

To add C/AL code to the table calculate the Cue data
Add a global function that is called CalcSalesThisMonthAmount as follows:

On the View menu, choose C/AL Globals.

On the Functions tab, in the Name column, enter CalcSalesThisMonthAmount.

Select the new function, and then in the View menu, select Properties.

Set the Local property to No.

In the C/AL Globals window, select the new function, and then choose Locals.

On the Return Value tab, set Name field to Amount and the Return Type field to Decimal.

On the Variables tab, add two variables as shown in the following table:

Name DataType Subtype
CustLedgerEntry Record Cust. Ledger Entry
CustLedgerEntrySales Query Cust. Ledg. Entry Sales

In C/AL code, add the following code on the CalcSalesThisMonthAmount function:

CustLedgerEntrySales.SETRANGE(Document_Type,CustLedgerEntry.”Document Type”::Invoice);

CustLedgerEntrySales.SETRANGE(Posting_Date,CALCDATE(‘<-CM>’,WORKDATE),WORKDATE);

CustLedgerEntrySales.OPEN;

IF CustLedgerEntrySales.READ THEN

Amount := CustLedgerEntrySales.Sum_Sales_LCY;

SI-Cue-5
Save the table.

Adding the Cue to the Role Center Page
To display the Cue fields on the Role Center, We will create a new Page [PageType  = CardPart] name Sales Invoice Cue.
SI-Cue-6

SI-Cue-7
Page Designer should look similar to shown above illustration.

Open the C/AL code for the page, and then add the following code to the OnAfterGetRecord Trigger to assign the Sales This month field to the CalcSalesThisMonthAmount function of table Sales Invoice Cue:

“Sales This Month” := CalcSalesThisMonthAmount;

SI-Cue-8
Also add code to the OnOpenPage Trigger.

RESET;
IF NOT GET THEN BEGIN
INIT;
INSERT;
END;

Formatting the Cue Data
We does not want to display any decimal places. To achieve this, we set the AutoFormatType Property and AutoFormatExpr Property of the Cue field on the page. As shown above.

To change the data format

In the Properties window, set the AutoFormatType property to 10.

This enables you to create a custom data format.

Set the AutoFormatExpr property to the following text.

‘<precision,0:0><standard format,0>’

<precision,0:0> specifies not to display any decimals places.

<standard format,0> specifies to format the data according to standard format 0.

Close the Properties windows, and then save and compile the page.

Run the Page created above the output should be similar to as below:
SI-Cue-9

Now you can add this CardPart Page to any of your Role Centre Page.

Development Tips, Office Integration

Using Automation to Create a Graph in Microsoft Excel

In this walkthrough, you will transfer data for top 10 Customers Sales Contribution to Microsoft Excel and create a graph.

This example shows how to handle enumerations by creating a graph in Excel that shows the distribution of Sales by Customer.

ExcelChart-1

You will run the codeunit directly from Object Designer. In a real application, you would call it from an appropriate place, such as from a menu or any other window.

About This Walkthrough

This walkthrough illustrates the following tasks:

  • Creating a codeunit that declares the Automation variables that are required for using Excel Automation.
  • Adding a function to calculate Top 10 Customers Sales Contribution.
  • Adding C/AL code to the codeunit to run the Automation object that opens Excel.
  • Adding C/AL code to the Automation codeunit to transfer data from a table record to Excel.
  • Adding C/AL code that creates a graph in Excel. 

Prerequisites 

To complete this walkthrough, you will need:

  • Microsoft Dynamics NAV 2015 with a developer license.
  • The CRONUS International Ltd. demo data company.
  • Microsoft Excel 2013 or Microsoft Excel 2010.

Creating the Codeunit and Declaring Variables

To create the codeunit and declare variables

  • To implement Automation in a codeunit, you define the Automation variables. To define an Automation variable, you specify an Automation server and the Automation object.
  • The language in the regional settings of your computer matches the language version of Microsoft Excel.
  • In Object Designer, choose Codeunit, and then choose the New button to create a new codeunit.
  • On the View menu, choose C/AL Globals.
  • On the Variables tab, add the following variables:

Note

For the Automation data type variables, the subtype Microsoft Excel 15.0/14.0 Object Library defines the Automation server, and the class specifies the Automation object of the Microsoft Excel 15.0/14.0 Object Library.

ExcelChart-2

Name DataType Subtype Length
xlApp Automation ‘Microsoft Excel 15.0 Object Library’.Application
xlBook Automation ‘Microsoft Excel 15.0 Object Library’.Workbook
xlSheet Automation ‘Microsoft Excel 15.0 Object Library’.Worksheet
xlChart Automation ‘Microsoft Excel 15.0 Object Library’.Chart
xlRange Automation ‘Microsoft Excel 15.0 Object Library’.Range
Cust Record Customer
Window Dialog
CustAmount Record Customer Amount
CustFilter Text
CustDateFilter Text 30
ShowType Option  [Sales (LCY),Balance (LCY)]
NoOfRecordsToPrint Integer
CustSalesLCY Decimal
CustBalanceLCY Decimal
MaxAmount Decimal
BarText Text 50
i Integer
TotalSales Decimal
TotalBalance Decimal
ChartType Option  [Bar chart,Pie chart]
ChartTypeNo Integer
ShowTypeNo Integer
ChartTypeVisible Boolean
Integer Record Integer
Customer Record Customer
CellNo1 Text 5
CellNo2 Text 5
  • Close the C/AL Globals window.

Adding the Code

Now you add the code for the codeunit.

To add the code

  • Add a Function to calculate Top 10 Customers Sales Contribution as:

ExcelChart-3
Add code to it as:

I have not used all the values, just shown this way also you can think of while you design any such code & functions.

Window.OPEN(Text000);

i := 0;

Cust.RESET;

IF Cust.FINDSET THEN

REPEAT

Window.UPDATE(1,Cust.”No.”);

Cust.CALCFIELDS(“Sales (LCY)”,”Balance (LCY)”);

IF (Cust.”Sales (LCY)” <> 0) OR (Cust.”Balance (LCY)” <> 0) THEN

BEGIN

CustAmount.INIT;

CustAmount.”Customer No.” := Cust.”No.”;

IF ShowType = ShowType::”Sales (LCY)” THEN BEGIN

CustAmount.”Amount (LCY)” := -Cust.”Sales (LCY)”;

CustAmount.”Amount 2 (LCY)” := -Cust.”Balance (LCY)”;

END ELSE BEGIN

CustAmount.”Amount (LCY)” := -Cust.”Balance (LCY)”;

CustAmount.”Amount 2 (LCY)” := -Cust.”Sales (LCY)”;

END;

CustAmount.INSERT;

IF (NoOfRecordsToPrint = 0) OR (i < NoOfRecordsToPrint) THEN

i := i + 1

ELSE BEGIN

CustAmount.FIND(‘+’);

CustAmount.DELETE;

END;

TotalSales += Cust.”Sales (LCY)”;

TotalBalance += Cust.”Balance (LCY)”;

ChartTypeNo := ChartType;

ShowTypeNo := ShowType;

END;

UNTIL Cust.NEXT = 0;

CustSalesLCY := Cust.”Sales (LCY)”;

CustBalanceLCY := Cust.”Balance (LCY)”;

Window.CLOSE;

IF CustAmount.FIND(‘-‘) THEN

REPEAT

CustAmount.”Amount (LCY)” := -CustAmount.”Amount (LCY)”;

Customer.GET(CustAmount.”Customer No.”);

Customer.CALCFIELDS(“Sales (LCY)”,”Balance (LCY)”);

IF MaxAmount = 0 THEN

MaxAmount := CustAmount.”Amount (LCY)”;

CustAmount.”Amount (LCY)” := -CustAmount.”Amount (LCY)”;

UNTIL CustAmount.NEXT = 0;

  • In the C/AL Editor, make call to above function by adding the following code to the OnRun trigger.

CustAmount.DELETEALL;

TopTenCustomer(10,ShowType::”Sales (LCY)”,ChartType::”Bar chart”);

  • Create an instance of Excel by adding the following code.

CREATE(xlApp, FALSE, TRUE);

  • Add a new workbook to Excel.

xlBook := xlApp.Workbooks.Add(-4167);

xlSheet:= xlApp.ActiveSheet;

xlSheet.Name := ‘Top 10 Customer’;

The following describes the code:

    • In the first line, you use the Add method of the Workbooks collection to return a new workbook. The attribute -4167 is the enumerator value of worksheets as they apply to Workbook objects.
    • In the second line, you use the ActiveSheet property of the Application class to ensure that what is done next affects the active sheet of the new workbook.
    • In the third line, you use the Name property to name the sheet.

Transferring Data

To transfer the data, you must calculate the data and transfer the results of the calculation.

To transfer data

  • In the C/AL Editor, on the codeunit, use following code to transfer data of Top 10 Customers to Excel. To transfer the data to Microsoft Excel, add the following code.

CellNo1 := ‘A1’;

CellNo2 := ‘B1’;

IF CustAmount.FINDSET THEN

REPEAT

CellNo1 := INCSTR(CellNo1);

xlSheet.Range(CellNo1).Value := CustAmount.”Customer No.”;

CellNo2 := INCSTR(CellNo2);

xlSheet.Range(CellNo2).Value := ABS(CustAmount.”Amount (LCY)”);

UNTIL CustAmount.NEXT = 0;

  • The final step is to create the graph. You will use the ChartWizard method to create chart. This is a fast and simple way to do it. You can more tightly control the design of the graph by setting it up using the methods and properties of the various Chart objects, such as ChartArea and Legend.

Creating the Graph

The final step is to create the graph. You will use the ChartWizard method to create chart. This is a fast and simple way to do it. You can more tightly control the design of the graph by setting it up using the methods and properties of the various Chart objects, such as ChartArea and Legend.

To create the graph

  •   In the C/AL Editor, on the current codeunit, define a range for the data in the graph.

xlRange := xlSheet.Range(‘A2:’+FORMAT(CellNo2));

  • Add a new chart sheet and give it a name.xlChart.Name := ‘ Top 10 Customer – Graph’;

xlChart := xlBook.Charts.Add;

xlChart.Name := ‘ Top 10 Customer – Graph’;

  • Create the graph.

xlChart.ChartWizard(xlRange,-4101,7,2,1,0,1,’Top 10 Customer’);

The following table describes the optional arguments that are used in the ChartWizard method.

Argument Description Value in method call
Source The range that contains the source data for the new chart. xlRange – The object returned by xlSheet.Range(‘A2:C3’).
Gallery The chart type. -4101 – The enumerator for the Chart Shown above.
Format The option number for the built-in auto formats. 7
PlotBy An integer specifying whether the data for each series is in rows or columns. 2 – The enumerator for the xlRows XlRowCol enumerator.
CategoryLabels An integer specifying the number of rows or columns within the source range that contains category labels. 1 – There is one row with category labels (the department names).
SeriesLabels An integer specifying the number of rows or columns within the source range that contains series labels. 0 – There are no series labels in your data.
HasLegend TRUE to include a legend. 1
Title VARIANT with the title of the chart. You pass a string such as ‘Top 10 Customer’.
  • Make Excel visible by adding the following code.

xlApp.Visible := TRUE;

Excel produces a General Protection Fault error when you close a new Excel worksheet that is created when Excel is invisible. To resolve this, you can make Excel visible immediately after you create a new worksheet. You can also make Excel visible just before you create a new Excel worksheet and then make it invisible again immediately after creating the new Excel worksheet. In this case, you would add the following code.

xlApp.Visible := TRUE;

xlBook := xlApp.Workbooks.Open(FileName);

xlApp.Visible := FALSE;

  •  Clearing the Temp Table by adding the following code.

CustAmount.DELETEALL;

  • Complete code in OnRun trigger should look like below:

ExcelChart-4
Saving and Running the Codeunit

You can test the codeunit for creating the graph by running the codeunit from Object Designer.

To save and run a codeunit

  1. On the File menu, choose Save.
  2. In the Save As window, enter an ID and name, and then choose the OK
  3. In Object Designer, select the codeunit, and then choose the Run

The Microsoft Excel graph should appear. As show above in beginning of the post.

Note

If you get an error states Old format or invalid type library, then make sure that the language in the regional settings of your computer matches the language version of Microsoft Excel.

Below detailed reference to the values used in above code:


XlChartType

Name Value Description
xl3DArea -4098 3D Area.
xl3DAreaStacked 78 3D Stacked Area.
xl3DAreaStacked100 79 100% Stacked Area.
xl3DBarClustered 60 3D Clustered Bar.
xl3DBarStacked 61 3D Stacked Bar.
xl3DBarStacked100 62 3D 100% Stacked Bar.
xl3DColumn -4100 3D Column.
xl3DColumnClustered 54 3D Clustered Column.
xl3DColumnStacked 55 3D Stacked Column.
xl3DColumnStacked100 56 3D 100% Stacked Column.
xl3DLine -4101 3D Line.
xl3DPie -4102 3D Pie.
xl3DPieExploded 70 Exploded 3D Pie.
xlArea 1 Area
xlAreaStacked 76 Stacked Area.
xlAreaStacked100 77 100% Stacked Area.
xlBarClustered 57 Clustered Bar.
xlBarOfPie 71 Bar of Pie.
xlBarStacked 58 Stacked Bar.
xlBarStacked100 59 100% Stacked Bar.
xlBubble 15 Bubble.
xlBubble3DEffect 87 Bubble with 3D effects.
xlColumnClustered 51 Clustered Column.
xlColumnStacked 52 Stacked Column.
xlColumnStacked100 53 100% Stacked Column.
xlConeBarClustered 102 Clustered Cone Bar.
xlConeBarStacked 103 Stacked Cone Bar.
xlConeBarStacked100 104 100% Stacked Cone Bar.
xlConeCol 105 3D Cone Column.
xlConeColClustered 99 Clustered Cone Column.
xlConeColStacked 100 Stacked Cone Column.
xlConeColStacked100 101 100% Stacked Cone Column.
xlCylinderBarClustered 95 Clustered Cylinder Bar.
xlCylinderBarStacked 96 Stacked Cylinder Bar.
xlCylinderBarStacked100 97 100% Stacked Cylinder Bar.
xlCylinderCol 98 3D Cylinder Column.
xlCylinderColClustered 92 Clustered Cone Column.
xlCylinderColStacked 93 Stacked Cone Column.
xlCylinderColStacked100 94 100% Stacked Cylinder Column.
xlDoughnut -4120 Doughnut.
xlDoughnutExploded 80 Exploded Doughnut.
xlLine 4 Line.
xlLineMarkers 65 Line with Markers.
xlLineMarkersStacked 66 Stacked Line with Markers.
xlLineMarkersStacked100 67 100% Stacked Line with Markers.
xlLineStacked 63 Stacked Line.
xlLineStacked100 64 100% Stacked Line.
xlPie 5 Pie.
xlPieExploded 69 Exploded Pie.
xlPieOfPie 68 Pie of Pie.
xlPyramidBarClustered 109 Clustered Pyramid Bar.
xlPyramidBarStacked 110 Stacked Pyramid Bar.
xlPyramidBarStacked100 111 100% Stacked Pyramid Bar.
xlPyramidCol 112 3D Pyramid Column.
xlPyramidColClustered 106 Clustered Pyramid Column.
xlPyramidColStacked 107 Stacked Pyramid Column.
xlPyramidColStacked100 108 100% Stacked Pyramid Column.
xlRadar -4151 Radar.
xlRadarFilled 82 Filled Radar.
xlRadarMarkers 81 Radar with Data Markers.
xlStockHLC 88 High-Low-Close.
xlStockOHLC 89 Open-High-Low-Close.
xlStockVHLC 90 Volume-High-Low-Close.
xlStockVOHLC 91 Volume-Open-High-Low-Close.
xlSurface 83 3D Surface.
xlSurfaceTopView 85 Surface (Top View).
xlSurfaceTopViewWireframe 86 Surface (Top View wireframe).
xlSurfaceWireframe 84 3D Surface (wireframe).
xlXYScatter -4169 Scatter.
xlXYScatterLines 74 Scatter with Lines.
xlXYScatterLinesNoMarkers 75 Scatter with Lines and No Data Markers.
xlXYScatterSmooth 72 Scatter with Smoothed Lines.
xlXYScatterSmoothNoMarkers 73 Scatter with Smoothed Lines and No Data Markers.

expression .ChartWizard(Source, Gallery, Format, PlotBy, CategoryLabels, SeriesLabels, HasLegend, Title, CategoryTitle, ValueTitle, ExtraTitle)

expression A variable that represents a Chart object.

Parameters

Name Required/Optional Data Type Description
Source Optional Variant The range that contains the source data for the new chart. If this argument is omitted, Microsoft Excel edits the active chart sheet or the selected chart on the active worksheet.
Gallery Optional Variant One of the constants of XlChartType specifying the chart type.
Format Optional Variant The option number for the built-in autoformats. Can be a number from 1 through 10, depending on the gallery type. If this argument is omitted, Microsoft Excel chooses a default value based on the gallery type and data source.
PlotBy Optional Variant Specifies whether the data for each series is in rows or columns. Can be one of the following XlRowCol constants: xlRows or xlColumns. Values can be [1 or 2]
CategoryLabels Optional Variant An integer specifying the number of rows or columns within the source range that contain category labels. Legal values are from 0 (zero) through one less than the maximum number of the corresponding categories or series.
SeriesLabels Optional Variant An integer specifying the number of rows or columns within the source range that contain series labels. Legal values are from 0 (zero) through one less than the maximum number of the corresponding categories or series.
HasLegend Optional Variant True to include a legend.
Title Optional Variant The chart title text.
CategoryTitle Optional Variant The category axis title text.
ValueTitle Optional Variant The value axis title text.
ExtraTitle Optional Variant The series axis title for 3-D charts or the second value axis title for 2-D charts.

Remarks

If Source is omitted and either the selection isn’t an embedded chart on the active worksheet or the active sheet isn’t an existing chart, this method fails and an error occurs.

You can use other values from above table to create graph of your choice.

Development Tips, Office Integration, Report

Using Automation to Write a Letter in Microsoft Office Word

Automation lets you use the capabilities and features of Microsoft Office products, such as Microsoft Word or Microsoft Excel, in your Microsoft Dynamics NAV application.

Today we will implement Word Automation from a customer card in the Microsoft Dynamics NAV Windows client.

Note: The Microsoft Dynamics NAV Web client does not support automation.

Most information that we need to transfer to Word for this example is in the Customer table. The Customer table contains a FlowField called Sales (LCY) that contains the aggregated sales for the customer.

In this example we are learning about Automation, so we will use the existing value. In a real customer installation, we would need to set up an appropriate date filter to get the sales for the past year only.

We also need to retrieve the information about our own company that we will use in the letterhead and in the greeting of the letter. This information is contained in the Company Information and User tables.

  • The Automation server must be installed on the computer that compiles an object that uses Automation. If you must recompile and modify an object on a computer that does not have the Automation server installed, then you must modify the code to compile it again. We recommend that you isolate code that uses Automation in separate codeunits.
  • Performance can be an issue if extra work is needed to create an Automation server with the CREATE system call. If the Automation server is to be used repeatedly, then you will gain better performance by designing your code so that the server is created only once instead of making multiple CREATE and CLEAR calls).

Performance can be improved by putting the code on the customer card because you do not have to open and close Word for each letter that is created in the session.

You can work around this problem. If Word is already open when it is called from the code, then the running instance is reused. You can manually open Word or do not close Word after creating the first letter.

We will extract and transfer data one customer at a time. We will also initiate this processing and the subsequent processing in Word from the customer card.

We will insert fields into the Word template and give these fields convenient mnemonic names that correspond to the names of the record fields that we are using.

To make this work, C/AL code must make two extra calls to Microsoft Office Word. You must call the ActiveDocument.Fields.Update method before using the fields. After you have transferred all the information, you must call the ActiveDocument.Fields.Unlink method. This ensures that you can successfully use the Word fields as placeholders.

In addition, while you can name the Customer or Address fields, you must reference them by indexing into the Fields collection of the document. This can make the C/AL code harder to understand.

Creating the Word Template for Use by Automation

First, task is to create a Word template that we will use to create letters to customers that qualify for a discount. To create the template, we will add mail merge fields for displaying data that is extracted from Microsoft Dynamics NAV that you want included in the customer letter, such as the customer’s name, contact, and total sales.

You will create and save the template on the computer running the Microsoft Dynamics NAV Windows client, because you will configure the automation object to run on the client.

  • On the computer running Microsoft Dynamics NAV Windows client, open Word and create a new document.

WordAutomation-1

  • Choose where you want to insert the fields. Then, on the Insert tab, in the Text group, choose Quick Parts, and then choose Field.

WordAutomation-2

  • In the Categories list, select Mail Merge.
  • In the Field names list, select MergeField.
  • In the Field Name box under Field Properties, type Contact. This field will display the name of your contact person at the customer site as taken from the Customer table.
  • Choose OK to add the field.

WordAutomation-3

  • Repeat steps as above to add the remaining fields as follows:
Field name Description Underlying table
Name The name of the customer. Customer
Address The address of the customer. Customer
Sales (LCY) The total amount that the customer has purchased from you. Customer
Company Name The name of your company. Company Information
  • Save the Word document as a template with the name Discount.dotx in folder of your choice.

WordAutomation-4

Creating the Codeunit and Declaring the Variables

The next step is to create the codeunit that calls Word and creates the letter.

To create the codeunit

  • In Object Designer, choose Codeunit, and then choose the New button to create a new codeunit.
  • On the View menu, choose Properties to open the Properties window of the codeunit.
  • In the TableNo field, choose the AssistEdit button to open the Table List window.
  • In the Table List window, select the Customer table, and then choose OK.

WordAutomation-5

  • Close the Properties window.

To declare the variables

  • Choose the OnRun Trigger and on the View menu, choose C/AL Locals, and then choose the Variables tab.
  • On a blank line, type wdApp in the Name field and set the Data Type field to Automation.

Note

When you create an Automation variable, some hidden events are also created for it. If you want to delete the variable, be aware that the events are also not deleted. This can cause issues if you then create a variable with the same name.

  • In the Subtype field, choose the AssistEdit button. The Automation Object List window is displayed.
  • In the Automation Server field, choose the AssistEdit button.
  • In the Automation Server List, select Microsoft Word 15.0 Object Library if you are running Word 2013, or select Microsoft Word 14.0 Object Library if you are running Word 2010, and then choose OK.
  • From the list of classes in the Automation Object List, select the Application class, and then choose OK.

WordAutomation-6

  • Repeat steps above to add the following two Automation variables:
Name Data type Subtype Class
wdDoc Automation Microsoft Word 14.0/15.0 Object Library Document
wdRange Automation Microsoft Word 14.0/15.0 Object Library Range
  • Add the following variables.
Name Data type Subtype Length
CompanyInfo Record Company Information
TemplateName Text 250
  • Close the C/AL Locals window.

Writing the C/AL Code

Before you start writing the C/AL code that uses Automation, you must do some initial processing. You start by calculating the Sales (LCY) FlowField. Then, you check whether the customer qualifies for a discount. Finally, you retrieve the information from the Company Information and User tables that you use to fill in some of the fields in the letter.

To write the C/AL code

  • In the C/AL Editor, add the following lines of code to the OnRun section.
  CALCFIELDS(“Sales (LCY)”);CompanyInfo.GET;
  • To create an instance of Word before using it, enter the following line of code.
 CREATE(wdApp, FALSE, TRUE);
  • This statement creates the Automation object with the wdApp variable.
    1. The first Boolean parameter in the statement (FALSE) tells the CREATE function to try to reuse an already running instance of the Automation server that is referenced by Automation before creating a new instance. If you change this to TRUE, then the CREATE function always creates a new instance of the Automation server.
    2. The second Boolean parameter in the statement creates the Automation object on the client. This is necessary to use this codeunit on a page in the Microsoft Dynamics NAV Windows client.
  • Enter the following lines of code to add a new document to Word that uses the template that you designed earlier. If required, replace C:\Users\atripathi5283\Desktop\Nav-2015\Word Letter with the correct folder path to the template that you defined in the procedure.
 TemplateName := C:\Users\atripathi5283\Desktop\Nav-2015\Word Letter\Discount.dotx’;wdDoc := wdApp.Documents.Add(TemplateName);wdApp.ActiveDocument.Fields.Update;
  • Because the Add method of the Documents collection requires that you pass the path to the template by reference, you must set up the TemplateName variable to hold this information. You will get a compilation error if you put the path into the call as a literal string.
  • The Documents property returns a Documents collection that represents all open documents. You can also see that the Documents collection object has an Add method, and that the Add method has the following syntax.
  • expression.Add(Template, NewTemplate, Document Type, Visible)
  • expression is a required argument, and it must be an expression that returns a Documents object. All the arguments are optional. You will use Template to open a new document that is based on your template.
  • For the syntax in the C/AL Symbol Menu, note that the Documents property returns an object of type DOCUMENTS, which is a user-defined type. The property returns a Documents class or IDispatch interface. This information helps the compiler perform a better type check during compilation. The following statement can also pass both the compile-time and the run-time type checks.
  • wdDoc := wdApp.Documents.Add(TemplateName);
  • Finally, the Add method returns a Document class. While you did not need to declare a C/AL variable for the interim Documents class, you have declared a variable for the wdDoc return value,.
  • The third line contains a call that must be made to ensure that the template works as intended.
  • wdApp.ActiveDocument.Fields.Update;

Transferring Data to Word

Now you can transfer the actual data from the Customer record to the placeholder fields in the Word document.

You have set up the first three fields in the template so that they can contain the contact, name, and address of the customer and you can transfer the data.

To transfer data to Word

  • Transfer the data by adding the following lines of code.
 wdRange := wdAPP.ActiveDocument.Fields.Item(1).Result; wdRange.Text := Contact; wdRange.Bold := 1; wdRange := wdAPP.ActiveDocument.Fields.Item(2).Result; wdRange.Text := Name; wdRange.Bold := 1; wdRange := wdAPP.ActiveDocument.Fields.Item(3).Result; wdRange.Text := Address; wdRange.Bold := 1;
  • You cannot use the fields directly as variables and make an assignment such as Fields.Item(3) := Address. Instead, you use the Result property of the field. This property returns the result of the field as a range. You place this range in the wdRange Automation variable that you declared.
  • You then set the Text property of the range to the desired values, which is the name of your contact person and the name and address of the customer. Finally, you add bold formatting.
  • The data you are transferring must be in text format. If it is not in text format, then you get a compilation error. wdRange.Text expects arguments to be of type BSTR, which maps to either Text or Code. This means that any data that is not Text or Code must be converted before it is passed to Word. To convert a field to Text, you use the FORMAT function. All the fields that are transferred in this step are in text format, so no conversion is needed and the FORMAT function is not used. However, in this example, you also need to transfer the Sales (LCY) field, which is a Decimal field. To see how to convert the Sales (LCY) field, go to the next step.
  • To transfer and format the data from the Sales (LCY) field, add the following code.
 wdRange := wdAPP.ActiveDocument.Fields.Item(4).Result;wdRange.Text := FORMAT(“Sales (LCY)”);wdRange.Bold := 0;
  • To transfer the information from the Company Information table, add the following code.
 wdRange := wdApp.ActiveDocument.Fields.Item(5).Result;wdRange.Text := CompanyInfo.Name;
  • To complete the processing in Word, add the following code.
 wdApp.Visible := TRUE;wdApp.ActiveDocument.Fields.Unlink;
  • The first statement opens Word and shows you the letter that was created. The second statement makes the fields work as placeholders.

WordAutomation-7

  • Save and compile the codeunit

To-Do List

Although this code will work, you must add a few things to make it complete:

  • We recommend that you do not use a hardcoded template name. You should keep the template name in a table, and the user should select it from a page. You can then have different templates for different types of letters that you want to send to your customers.
  • You should add some error-handling code. For example, the CREATE call fails if the user does not have Word installed or if the installation has been corrupted. You should check the return value of CREATE and give an appropriate message if it fails.
  • The user should get a message if the customer does not qualify for the discount. In the example, the codeunit closes without any message.

Calling the Codeunit from the Customer Card

The final task is to ensure that you can call the codeunit from the Customer Card page in the Microsoft Dynamics NAV Windows client.

To call the codeunit from the Customer card page in the Microsoft Dynamics NAV Windows client

  • Open Object Designer, and then choose Page.
  • Select the Customer Card page and then choose Design.
  • On the View menu, choose Page Actions.
  • To add a new action, locate the action container with the subtype set to ActionItems.
  • Right-click the next line after the ActionItems container, and then choose New.
  • In the Caption field of the new line, type Word Letter.
  • Set the Type field to Action.
  • With the new action selected, on the View menu, choose Properties.
  • In the RunObject field, type codeunit Discount Letter.

Note

If you saved the codeunit that you created in the previous procedure under a different name, then substitute Discount Letter with the name that you used.

  • Use the arrow buttons to make sure that the new action is indented only once from the ActionItems container above it

WordAutomation-8

  • Save and compile the Customer Card page.

To run the Customer Card and view the Word letter

  1. In Object Designer, choose the Page
  2. Select the Customer Card page, and then choose Run.
  3. In the ribbon, on the Actions tab, choose the Word Letter

The letter document opens in Word.

WordAutomation-9

Next Steps

The letter that you have just created only contains five fields and sample body text. Before you can use this letter in an actual situation, you will need to add some more fields, such as the name and address of your own company, the date, and the currency code, and the main text of the letter. It will also need some formatting to make it look more attractive. If you alter the order in which the fields appear in the template, you must change the numbering of the fields in the codeunit to ensure that the correct data is inserted into the appropriate fields.