Data Model, Development Tips, Excel, How To, PowerPivot

Set Data Categories for fields in PowerPivot

In order for Power View to dynamically create reports based on underlying data, such as location, fields that contain such data must be properly categorized.

Open the Excel Workbook we created in our earlier post. Create a Power View report

For the Olympics data, let’s specify the categories for a few fields.

  • In Power Pivot, select Hosts. Select the NOC_CountryRegion field. From Advanced -> Reporting Properties -> Data Category: click the arrow and select Country/Region from the list of available data categories, as shown in the following screen.

ExcelData-37

  • Return to Excel, and select the Power View sheet. Expand the Medals table in Power View Fields, and notice that the NOC_CountryRegion field now has a small globe icon beside it. The globe indicates that NOC_CountryRegion contains a geographic location, as shown in the following screen.

ExcelData-38

We’ll use that geographic location in an upcoming post. It’s time to save your work, review what you’ve learned, and then get ready to dive into the next post.

I will come up with more details in my next post. Till then Stay Tuned, Keep Learning & Practicing.

Data Model, Development Tips, Excel, How To, Power View, PowerPivot

Set Table Behaviour in PowerPivot

You can set the default table behaviour, which Power View uses to automatically create report labels for the table.

This becomes useful when you create visualizations from the same table, perhaps for many different reports.

Open the Excel Workbook we created in our earlier post. Create a Power View report

We use default table behaviour in the next few steps, so let’s set it now.

Open Medals Table in Data Model, select Advanced > Reporting Properties > Table Behaviour. A window appears where you can specify table behaviour.
ExcelData-33

  • In the Table Behavior window, the Row Identifier is the column that contains only unique keys and no blank values. This is often the table’s primary key, but not compulsory to be any other field which satisfy this property. You have to select a Row Identifier before making other selections in the window. Select MedalKey as the Row Identifier.
  • In the Keep Unique Rows section, select AthleteID.

Fields you select here have row values that should be unique, and should not be aggregated when creating Pivot Tables or Power View reports.
Note: If you have trouble with reports that don’t aggregate how you want them, make sure that the field you want to aggregate is not selected in the Keep Unique Rows fields.

  • For Default Label, select a key that should be used as a default report label. Select Sport.
  • For Default Image, leave the selection as [No Column Selected], since you haven’t added images yet. The Table Behavior window looks like the following screen.

ExcelData-34

  • On the Power View sheet in Excel, select the table you created in the previous post Set field defaults in PowerPivot
  • From the ribbon, select DESIGN -> Table -> Card.

ExcelData-35

  • The table you created changes into a collection of Cards; the data is the same, but the visualization of the data has changed. The table now looks like the following screen.

ExcelData-36

Notice that the Sport field is larger than the rest, and appears as a heading for each card. That’s because we set Sport as the Default Label in the Table Behavior window when we were in Power Pivot.

I will come up with more details in my upcoming posts. Till then Stay Tuned, Keep Learning & Practicing.

Data Model, Development Tips, Excel, How To, Power View, PowerPivot

Set field defaults in PowerPivot

When you set a default field set for a table, you can simply click that table in Power View, and the default set of fields is automatically added to a new report.

Open the Excel Workbook we created in our earlier post. Create a Power View report

In today’s post, we will learn how to set defaults for our workbook that will save our time when creating reports.

Steps to Create the Default Field Set for a table

  • Select the Medals table in Data View Mode from PowerPivot Manager.
  • From the Advanced tab, select Reporting Properties > Default Field Set. A window appears that lets you specify default fields for tables created using client tools such as Power View.
  • Select Sport, Event, EditionID, Athlete, and Medal in the left pane, and click Add -> to make them the default fields.

ExcelData-31

To see how this works, switch to the Power View sheet in Excel.

  • Click anywhere on the blank report canvas, to make sure you don’t have an existing visualization selected. Your Power View sheet currently only has one visualization, which is the map you created earlier in previous post. Create a Power View report
  • In the Power View Fields list, click the Medals table name. Power View creates a table and automatically adds the five default fields from the Medals table, in the order you specified, as shown in the following screen. Make sure you don’t click on the triangle beside Medals, if you do so the table simply expands, rather than adding a new table with default fields.

ExcelData-32

I will come up with more details on this topic in my upcoming posts. Till then Stay Tuned, Keep Learning and Practicing.

Data Model, Development Tips, Excel, How To, PowerPivot

Create a calculated field in PowerPivot

Open the Excel workbook which we used in our previous post on this topic. Olympics Excel Work book.

Select PowerPivot -> Manage

PowerPivot Window will open, If Calculation area not visible below table data as shown in below screen. Click Calculation Area button in Top Right Corner.

ExcelData-27

In the Calculation Area, select the cell directly below the Edition column. From the ribbon, select AutoSum > Distinct Count, as shown in the following screen.
ExcelData-28

Power Pivot automatically created the following DAX formula: Distinct Count of Edition:=DISTINCTCOUNT([Edition])

Additional calculations in AutoSum are just as easy, such as Sum, Average, Min, Max, and others.

Let’s calculate the percentage of all medals. In the formula bar, type the following DAX formula. IntelliSense provides available commands based on what you type, and you can press Tab to select the highlighted IntelliSense option. Percentage of All Medals:=[Count of Medal]/CALCULATE([Count of Medal],ALL(Medals))
ExcelData-29

When we return to Excel Sheet we can find these fields available in Medal Table. Shown in the right side of the screen above.

Let’s create a PivotTable from Medal Table. Our Pivot Table will be designed as below screen.
ExcelData-30

I will come up with more details inn my upcoming posts. Till then stay tuned, keep Learning and keep practicing.

Corfu Navision 2016, How To, Information, Posting Preview

Posting Preview in Navision 2016

On every document and journal that can be posted, you can choose the Preview Posting button to review the different types of entries that will be created when you post the document or journal.

Below I have shown Example from Sales Invoice Window, similarly you will get in other related Pages too.
PreviewPosting-1

From Actions TAB you will get this option for Preview Posting.

You will get below Navigation Window where you can Navigate Entries which will get posted upon Posting.
PreviewPosting-2
Give it a try, very useful feature introduced in Navision 2016.

Corfu Navision 2016, How To, Information, Permission, User Group

Record Permissions and Apply Permissions Sets to User Groups in Navision 2016

Administrators can record new permission sets in Microsoft Dynamics NAV 2016.

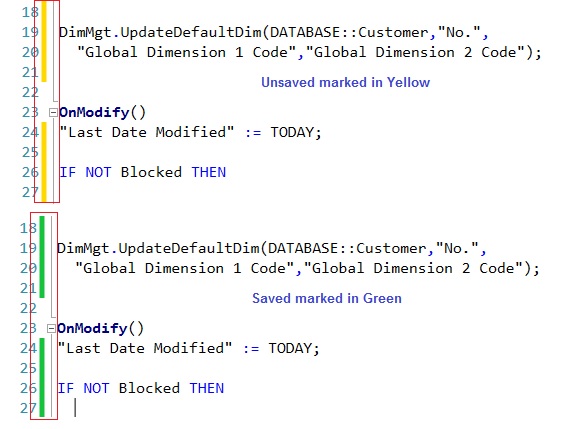
Recording permissions is based on the code coverage functionality.

You can access the various windows and activities in the Microsoft Dynamics NAV Windows client or the Microsoft Dynamics NAV Web client that you want users with this permission set to access.

You must carry out the tasks that you want to record permissions for. Then, you can apply the new permission set to a group of users.

A user group is a combination of roles and users. If you want to change permissions for the user group, the changes are automatically applied to the users who are members of the group.

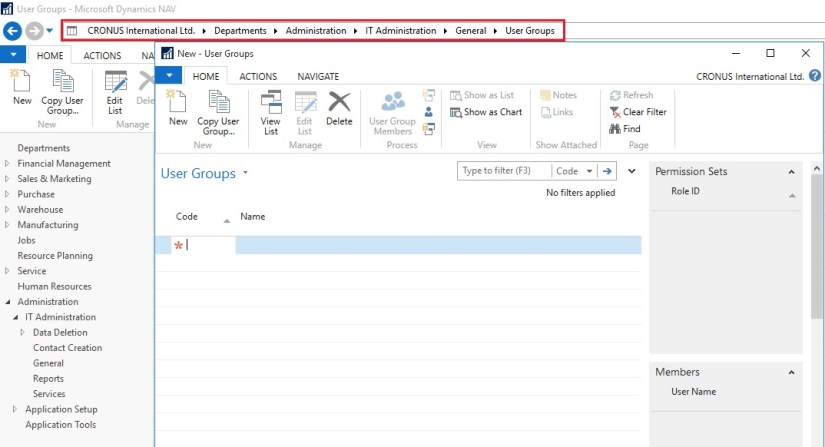
To help you manage permissions in Microsoft Dynamics NAV for your company, you can set up one or more user groups, add permissions sets to the groups, and then add users to the groups. You can add more than one permission set to a user group.

In the User Groups window, you can set up user groups, add and remove permissions, and you can apply changes to all or specific user groups.
Permission-1

Permission-2

Permission-3

Permission-4

Permission-5
If the default permission sets that are provided with Microsoft Dynamics NAV are not sufficient or not appropriate for your organization, then you can create new permission sets. If the individual object permissions that define a permission set are not adequate, then you can modify a permission set.

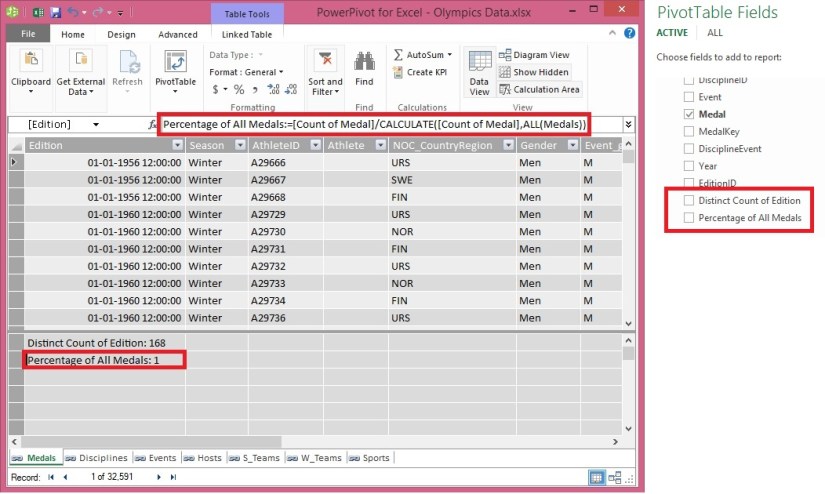
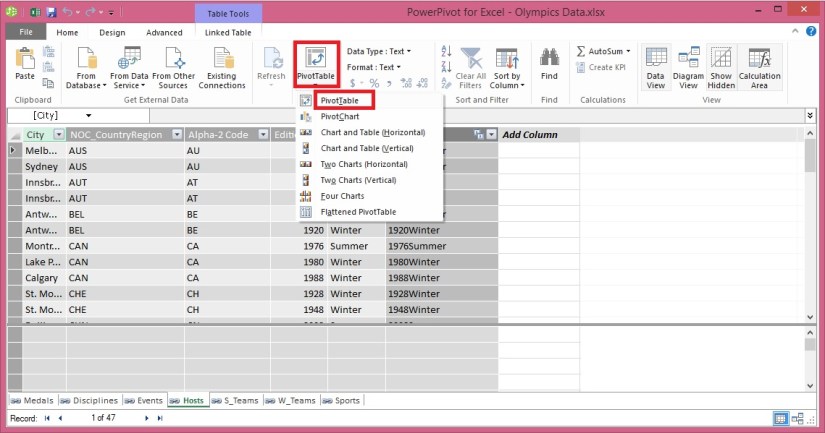
You can create a permission set manually, or you can record permissions by navigating in the application.
Permission-6

Permission-7

Permission-8
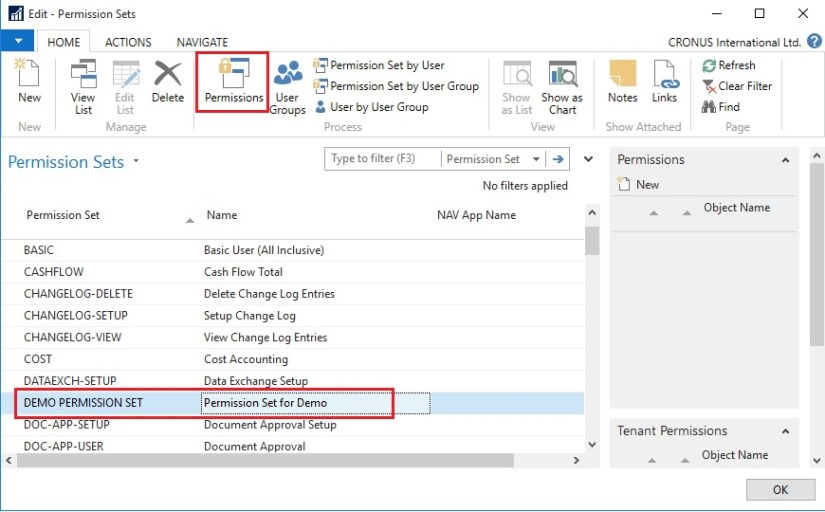
This starts a recording process that is based on the code coverage functionality in Microsoft Dynamics NAV. You can now access the various windows and activities in the Microsoft Dynamics NAV Windows client or the Microsoft Dynamics NAV Web client that you want users with this permission set to access. You must carry out the tasks that you want to record permissions for.

When you want to finish the recording, return to the Permissions window, and then, on the Actions tab, choose Stop.

Choose Yes to add the recorded permissions to the new permission set, or choose No to cancel.

If you choose Yes, the objects that you accessed are added to the window. In Microsoft Dynamics NAV 2016, only the objects are recorded, so you must specify if users must be able to insert, modify, or delete records in the recorded tables.

C/AL Editor, Corfu Navision 2016, Information

Redesigned C/AL Editor in Navision 2016

The C/AL Editor in the Microsoft Dynamics NAV Development Environment has been redesigned to give you more coding capabilities. Coding in the new C/AL editor is like before except you benefit from new features such as IntelliSense, name completion, change tracking, improved syntax highlighting and colorization. The new design has a look-and-feel that resembles the Debugger regarding breakpoints.

Name Completion:  Editor-1

Now Editor suggest the Variable Names which are available.

IntelliSense:  Editor-2
Now Editor Suggest available options for the variables.
Editor-3

Change Tracking:  Editor-4

Improved syntax highlighting and colorization:
Editor-5
If you still want to use old version editor, you can use the old version of the C/AL Editor by running the Microsoft Dynamics NAV Development Environment from a command prompt and setting the useoldeditor parameter.
Editor-6

finsql.exe useoldeditor=yes

useoldeditor Specifies whether to use the C/AL Editor that was available in Microsoft Dynamics NAV 2015 and earlier versions. The C/AL Editor was redesigned in Microsoft Dynamics NAV 2016.

To use the old editor, specify the parameter as useoldeditor=yes or useoldeditor.

To use the new editor, omit the parameter or specify it as useoldeditor=no.

Data Model, Development Tips, Excel, How To, PivotTable, PowerPivot, Report

Use hierarchies in PivotTables

Recall from my previous post Create a hierarchy in PowerPivot Data Model, We will continue from where we left our earlier post.

Now we have a Sports hierarchy and Locations hierarchy, we can add them to PivotTables or Power View, and quickly get results that include useful groupings of data.

Prior to creating hierarchies, you had to add individual fields to the PivotTable, and arrange those fields how you wanted them to be viewed.

In this post we will use the hierarchies created in the previous post to quickly refine our PivotTable.

Open the Excel workbook which we used in our previous post and Insert PivotTable as shown in below screen.
ExcelData-17

  • Add field in the PivotTable Medal from Medal Table in the FILTERS area, and Count of Medal from Medal Table in the VALUES area. Your nearly empty PivotTable should look like the following screen.

ExcelData-18

  • From the PivotTable Fields area, drag SDE from the Events table to the ROWS area. Then drag Locations from the Hosts table into the COLUMNS area. Just by dragging those two hierarchies, your PivotTable is populated with a data, all of which is arranged in the hierarchy we defined in the previous steps. Your screen should look like the following screen.

ExcelData-19

  • You can expand any of those Sports in the PivotTable, which is the top level of the SDE hierarchy, and see information in the next level down in the hierarchy (discipline). If a lower level in the hierarchy exists for that discipline, you can expand the discipline to see its events. You can do the same for the Location hierarchy, the top level of which is Season, which shows up as Summer and Winter in the PivotTable.

ExcelData-20

ExcelData-21
By dragging those two hierarchies, you quickly created a PivotTable with interesting and structured data that you can drill into, filter, and arrange.

I will come up with more details and other options on this topic in my upcoming posts. Till then keep learning and practicing.

Corfu Navision 2016, Information

Changes in C/AL Behaviour C/AL Statements in Nav 2016

The following table lists the summary of new, removed, or changed C/AL statements in Microsoft Dynamics NAV 2016.

Will come with more details in my later posts.

Statement Description
FOREACH New statement.

Iterate through a .NET Framework collection or array.

BREAK New statement.

Terminates the iteration statement in which it used.

Important

If your solution has used FOREACH or BREAK as names of variables in earlier versions of Microsoft Dynamics NAV, you must change the names before you upgrade to Microsoft Dynamics NAV 2016.

Alternatively, you can enclose the variable names in quotation marks. If you do not, and you import an object that has this code in text format, you cannot compile the object.

Corfu Navision 2016, Information

Changes in C/AL Behaviour C/AL Properties in Nav 2016

The following table lists the summary of new, removed, or changed properties in Microsoft Dynamics NAV 2016.

Will come with more details in my later posts.

Function Description
Event Property New property.

Used for events. Specifies whether a function is a publisher of or subscriber to an event.

EventFunction Property New property.

Used for events. Specifies the event publisher function that an event subscriber function subscribes to.

EventPublisherObject Property New property.

Used for events. Specifies the object that contains the event publisher function that an event subscriber function subscribes to.

EventSubscriberInstance Property New property.

Specifies how event subscriber functions in a codeunit are bound to codeunit instance and events that they subscribe to.

EventType Property New property.

Used for events. Specifies whether an event is a business or integration event.

GlobalVarAccess Property New property.

Used for events. Specifies whether global variables in an event publisher object can be accessed from event subscriber functions.

IncludeSender Property New property.

Used for events. Specifies whether global functions in an event publisher object can be called from event subscriber functions.

Namespaces Property New property.

Specifies one or more namespaces on an XMLport object.

NamespacePrefix Property New property.

Specifies a namespace prefix on an element of an XMLport object.

OnMissingLicense Property New property.

Specifies what happens to the event subscriber function call when the license of the Microsoft Dynamics NAV user account that is running the current session does not include the codeunit that contains the subscriber function.

OnMissingPermission Property New property.

Specifies what happens to the subscriber function call when the Microsoft Dynamics NAV user account that is running the current session does not have permission to the codeunit that contains the subscriber function.

EventPublisherElement Property New property.

Used for events. Specifies the table field that the trigger event pertains to.

Scope Property New property.

Specifies the scope of actions to be either Repeater or Page.

SQL Timestamp Property New property.

Specifies a field to be a timestamp field that contains row version numbers for records.

TableType Property Specifies whether the table is a normal or external (CRM or ExternalSQL) table.
TryFunction Property New property.

Specifies the function to be try function, which can be used to catch and handle errors and exceptions that occur when code is run.

FunctionType Property (Upgrade Codeunits) Changed property.

Instead of the Upgrade option, there are now two options: UpgradePerCustomer and UpgradePerDatabase. The UpgradePerCustomer option behaves like the Upgrade option in the previous Microsoft Dynamics NAV version.

FunctionType Property (Test Codeunits) Changed property.

Includes the FilterPageHandler and HyperlinkHandler options.