Corfu Navision 2016, Development Tips, How To, XMLports

Multiple namespace support in XML Ports – Microsoft Dynamics NAV 2016

Microsoft Dynamics NAV 2016 now enables developers to create XMLPorts which contain more than one namespace. Namespaces are used to distinguish fields and provide uniqueness.

The inclusion of namespaces enables parties to tag elements and resolve any ambiguity.

What is default Namespace?

This property specifies the default namespace for both import and export. The default value is unique for different XMLports.

For example, the following string specifies a namespace: urn:microsoft-dynamics-nav/xmlports/x100, where 100 is the ID of the XMLport.

What is Namespace?

You can use this property to declare one or more namespaces on the XMLport.

To add a namespace, you can choose the AssistEdit button or enter the namespaces directly in the field.

A namespace declaration consists of prefix and the namespace name, which has the format prefix=namespace. Separate multiple namespaces with a comma.

In the XML documents exported or imported by the XMLport, the namespaces declarations are only supported in the <root> element.

For example, if an XMLport has the namespace mynavprefix=mynavnamepace and the default namespace urn:nav:schema:all, then the root element will be as follows:

<Root xmlns:mynavprefix=”mynavnamespace” xmlns=”urn:nav:schema:all”>

To specify a default namespace, leave the Prefix field blank.

You can also specify the default namespace by specifying the namespace in the DefaultNamespace Property and setting the UseDefaultNamespace Property to Yes.

However, there can only be one default namespace. So if you want to specify a default namespace in the Namespace property, you must set the UseDefaultNamespace Property to No.

How to Define Namespace:
Namespace-1

Using Namespace:
Namespace-2

The final XMLport will be as below:
Namespace-3

Now save your XMLport and execute it.
Namespace-4

The output will be similar to below:
Namespace-5

Conclusion:

  • Multiple namespaces are defined in the root element of the XMLport and have their own property editor for defining them.
  • Developers can easily select the namespace via lookups on the element record.
  • XMLports are accessible both for developers and super users. Including the namespace prefix in the core editor lets you see key data while developing.

I will come up with more information in my upcoming posts.

Corfu Navision 2016, Development Tips, Functional Tips, How To, Information, Workflow

Workflows in Dynamics NAV 2016

Workflows in Dynamics NAV are represented by workflow events and workflow responses.

The smallest workflow is the pairing of a single event with a single response.

“When something happens, do something” pattern. This is the Event/Response model that makes up the simple but effective design of Workflow for Microsoft Dynamics NAV.

The workflow functionality utilizes several other features as listed below of Dynamics NAV.

Few Listed here below:

Job Queues Setup

E-mail Notification Setup

Work date Setup

User Setup

Approval User Setup

SMTP Mail Setup

In particular, approvals and notifications must be set up so that workflows can send approval requests and process approvals.

Dynamics NAV 2016 introduces two new event concepts. Events and Workflow events. The two are distinct but often coupled together to build solutions.

Dynamics NAV Events allow you to write code which will be called when an event occurs – this is called subscribing to an event.

Workflow Events typically use Platform Events as their trigger, but are richer. Workflow events are registered in the workflow engine and show up in the workflow designer. Microsoft recommends that Workflow events be written at a higher level of abstraction than Platform Events.

Sales Invoice is created or Modified could be example of Event Subscriber, whereas Invoice is Release could be good example for Workflow Event.

Event

For the event we need a new codeunit.

Add helper method for binding our event with the workflow engine.

The method is a simple one which returns and identifying code.

Function Signature:

LOCAL OnMyEventCode() : Code[128]

Function Property:
Workflow-1

Sample Function Code:

EXIT(UPPERCASE(‘OnMyEvent’));


Next we add another method which will be called whenever our Event Occurs

Function Signature:

LOCAL [EventSubscriber] OnMyEvent(VAR Rec Object;VAR xRec Object;RunTrigger : Boolean)

Assuming a table is selected on which the Event is triggered.

Function Property & Variables:
Workflow-2

Sample function code:

MESSAGE(‘Event Fired On MyEvent’);

WorkflowManagment.HandleEvent(OnMyEventCode,Rec);

For the code itself, we’ll do two things

  • Show a message box so we can see our event did trigger
  • Call into the workflow engine to have the NAV Workflow engine process any next steps


Then we need to add another event subscriber method which is responsible for adding our event to the workflow library. The workflow library is the collection of events which can be seen and managed from the Workflow Setup page.

Function Signature:

LOCAL [EventSubscriber] AddEventToLibrary()

Function Property & Variables:
Workflow-3

Sample function code:

WorkflowEventHandling.AddEventToLibrary(MyEventCode,DATABASE::Object,OnMyFinishTxt,0,FALSE);

Text Constant for Event Description:

OnMyFinishTxt : This will be listed in Workflow Event Window.
Workflow-4

To add a Workflow event we need to do three things:

  • Subscribe to the event.
  • Define a user readable string which describes the event.
  • Call a method in the workflow event handling codeunit, passing in the identifier and the descriptive string.

Save the Codeunit as MyWorkflowEvent with available ID in your Database.

Response

Most of the work is done in the code editor and we will use codeunits for our application objects.

First we’ll make a helper method for binding our response with the workflow engine.

The method is a simple one which returns and identifying code.

Function Signature:

LOCAL RunMyResponseCode() : Code[128]

Function Property:
Workflow-1

Sample Function Code:

EXIT(UPPERCASE(‘RunMyResponse’));


Then we need to add another event subscriber method which is responsible for adding our response to the workflow library. The workflow library includes the collection of responses which can be seen and managed from the Workflow Setup page.

Function Signature:

LOCAL [EventSubscriber] AddResponseToLibrary()

Function Property & Variables:

Workflow-5

Sample Function Code:

WorkflowResponseHandling.AddResponseToLibrary(RunMyResponseCode,0,ResponseDescription,’Group 0′);

Text Constant for Response Description:

ResponseDescription : This will be listed in Workflow Responses Window.

Workflow-6

To add a Workflow response we need to do three things:

  • Subscribe to the event which adds new responses to the workflow library
  • Define a user readable string which describes the response
  • Call a method in the workflow response handling codeunit, passing in the identifier and the descriptive string.

The earlier functions were used to add the response to the workflow library.

But we need another method that actually listens to when the response needs to be called.

Function Signature:

LOCAL [EventSubscriber] RunReportResponse(VAR ResponseExecuted : Boolean;Variant : Variant;xVariant : Variant;ResponseWorkflowStepInstance : Record “Workflow Step Instance”)

Function Property & Variables:

Workflow-7

Sample Function Code:

IF WorkflowResponse.GET(ResponseWorkflowStepInstance.”Function Name”) THEN

CASE WorkflowResponse.”Function Name” OF

RunMyResponseCode:

BEGIN

RunMyFunction;

ResponseExecuted := TRUE;

END;

END;

When this code is called it needs to do two things.

Firstly it needs to evaluate if the response should be called (and it does this by checking the code value) and secondly it should return TRUE if it handles the response.

Finally we will add our Response Handling Function RunMyFunction, which will execute actual action which we want Response of this call.

Enable Workflow in System

First we will create our Category so that our Workflow can be identified uniquely.

Workflow-8

Next we will configure our Workflow.

Workflow-9

Here my workflow is listed once configured and saved.

Workflow-10

Now we are good in position to go for testing of our workflow.


This was the simplest scenario with bare minimum action required of implementing workflow.

You can use existing Template and define or you can implement your own as described above.


I will come up with more details on this topic later in my upcoming posts.

Corfu Navision 2016, Development Tips, Events, How To

Implementing Events in Navision 2016

Recall from my earlier post for description of Events – Events in C/AL Navision 2016

Here in this post we will see how to implement the same.

This could be helpful in situation where throughout the system you wish to have similar behaviour on specific condition. In general we will have to write code in every object with same set of logic, variables, and functions and so on.

Although still in this case too we will require to add code to every object, but only one time.

Think of you need to enhance or make changes in behaviour again you will have to go through each objects and do the required change. But using this feature we can keep it centralized and manage from single place, without going through each objects again.

Here below I am taking example one explained by Microsoft help basic concept, will come up with my version with some more effective usage later sometime.

When users change the address of a customer, you want to check that the address does not include invalid characters, which in this walkthrough is a plus sign (+).

To accomplish this, you will publish an event that is raised when the Address field on page 21 Customer Card is changed.

To handle the event when it is raised, you will add an event subscriber function that includes logic that checks the address value and returns a message to the user if it contains a plus sign.

Publishing the Event

To publish an event, you create a C/AL function that is set up to be an event publisher. An event publisher function can be added in any object, such as a codeunit, page, or table.

In this procedure we will add the event publisher function to a new codeunit, in which you can potentially add more event publisher functions for other events later.

Because you might want to change this event implementation in the future, you decide to create an integration event type.

The event publisher requires a single text parameter for handling the address of the customer.

Create a new codeunit

The codeunit for the event publisher I have created 50000 – Event Publisher.

Now we will add the event publisher function to publish the event.
Events-1

To create the event publisher function to publisher the event

  • Define a function OnAddressLineChanged.
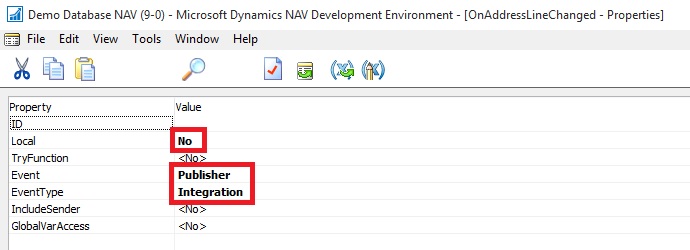
  • Open the properties for the OnAddressLineChanged function, select the function, and then in the View menu, choose Properties. Set the properties as follows:
  • Set the Local property to No.

Setting this property makes the function available to be called from the other objects.

  • Set the Event property to Publisher. This makes the function an event publisher.
  • Set the EventType property to Integration.
  • Close the Properties

Events-2

  • Add a local parameter to the function for the address of the customer as described in the following steps:
  • On the Functions tab, select the OnAddressLineChanged function, and then choose the Locals

The C/AL Locals window opens.

  • On the Parameters tab, in the Name field, enter line.
  • Set the DataType field to Text.
  • Set the Length field to 100.

Events-3

Important

An event publisher function cannot have a return value, variables, or text constants; otherwise you will not be able to compile the function.

The new function appears in the C/AL Editor with the following signature:

[IntegrationEvent] OnAddressLineChanged(line : Text[100])
Events-4

You can now raise the event in the application.

Raising the Event

After creating the event publisher function to publish the event, now we will add code to the application to raise the event where it is required.

In this case, the event will raise when the Address field is changed on the page 21 Customer Card.

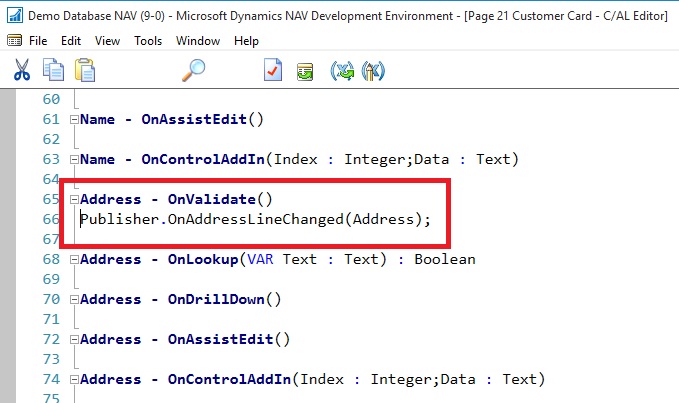
Therefore, we will add code to the Address – OnValidate() trigger in C/AL code of the page. Raising an event basically involves calling the event publisher function that publishes the event.

To raise the event

  • In the development environment, open page 21 Customer Card as follows:
  • Add a C/AL variable that specifies the object that publishes the event. In this case, the event publisher object is codeunit 50000 Event Publisher, which contains the event publisher function OnAddressLineChanged that you created in the previous procedure.

Events-5

  • In C/AL code, add the following code on the Address – OnValidate() trigger to raise the event:

Publisher.OnAddressLineChanged(Address);

This calls the event publisher function to raise the event.
Events-6

  • Save and compile the changes to the page.

The event can now be subscribed to and handled.

Subscribing to and Handling an Event

Once an event has been published you can add code to the application that subscribes to and handles the event when it is raised.

For example, in this case when a user changes the address of a customer (the event), you want code that checks that the value does not contain a plus sign.

Subscribing to and handling an event is accomplished by creating a C/AL function that is set up as an event subscriber and subscribes to a specific event (defined by an event publisher function). The event subscription function contains the application logic for handling the raised event.

In this case, we will create an event subscriber function that subscribes to the OnAddressLineChanged function in codeunit 50000 Event Publisher.

Unlike an event publisher function, an event subscriber function can only reside in a codeunit object. This procedure will add the event subscriber function to a new codeunit, in which you can potentially add more event subscriber functions for other events later.

To create a new codeunit

  • In the development environment, create a new codeunit that has the ID 50001 and the name Event Subscriber.

To create the event subscriber function to subscribe to and handle the event

  • Create Function CheckAddressLine.

Events-7

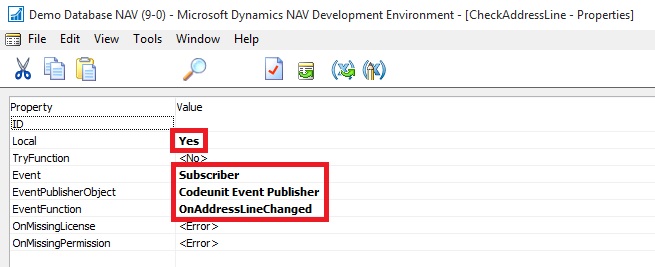
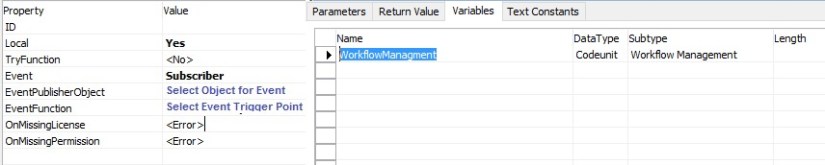
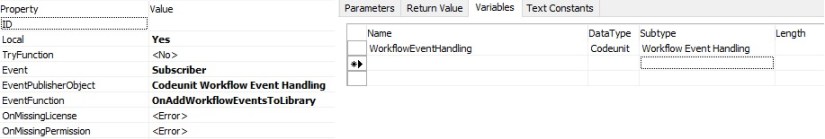
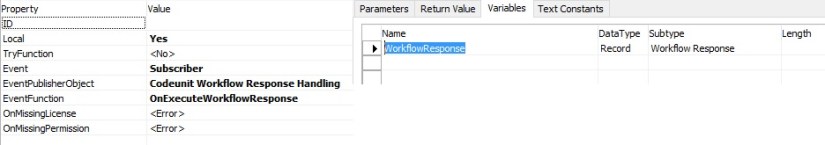
  • Choose Properties. Set the properties as follows:
  • Set the Event property to Subscriber to make the function an event subscriber.
  • Set the EventPublisherObject property to Codeunit My Publishers.

This is the codeunit that contains the event publisher function (OnAddressLineChanged) that you want to subscribe to.

  • In the EventFunction property, select the OnAddressLineChanged integration event.

This field reads all the published events in the event publisher object.
Events-8

Note

When you get a message that asks whether you want to overwrite the edited function’s signature, choose Yes to continue.

  • A local parameter that has the name line and the data type Text has been automatically added to the new CheckAddressLine
  • The new function appears in the C/AL Editor with the following signature:

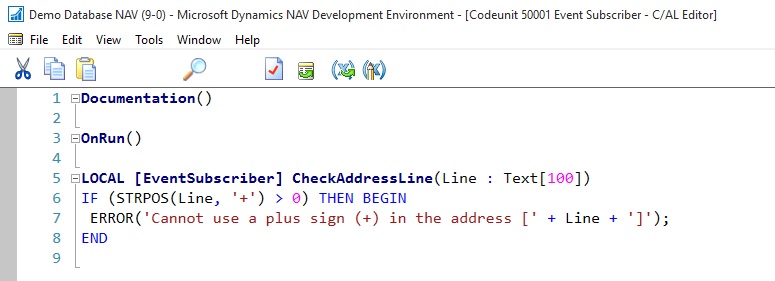
LOCAL [EventSubscriber] CheckAddressLine(line : Text[100])

You can now add code to handle the event.

  • To handle the event, add the following code to the CheckAddressLine function in the C/AL editor:

IF (STRPOS(line, ‘+’) > 0) THEN BEGIN

ERROR(‘Cannot use a plus sign (+) in the address [‘ + line + ‘]’);

END

This code checks the value of the Address field on page 21 Customer Card when is has been changed and returns a message if the value contains a plus sign.
Events-9

Viewing the New Event Subscription

After you create an event subscriber, you can view information about it in page 9510 Event Subscriptions. This page provides information about all the current event subscriptions in the application. You can open this page directly from the development environment or from a Microsoft Dynamics NAV client.

To view the event subscription from the development environment

  • On the Tools menu, choose Debugger, and then choose Event Subscriptions.

Events-10

To view the event subscription from a Microsoft Dynamics NAV client

  • Start the Microsoft Dynamics NAV client.
  • In the Search box, enter Sessions, and then choose the related link.

Events-11

The Even Subscription Window will look like:
Events-12

Testing the Event

To test the event implementation, you can run page 21 Customer Card from the development environment.

  • In the Address field, add a plus sign, and then choose the OK

The following message appears:

Cannot use a plus sign (+) in the address [].

[] contains the value of the Address field.
Events-13

I will come up with more details on this topic later in my future posts.

Corfu Navision 2016, Development Tips

Using a Timestamp Field in Navision 2016

Each table in Microsoft Dynamics NAV includes a hidden timestamp field.

The timestamp field contains row version numbers for records as maintained in SQL Server.

You can expose the timestamp field in a table, and then write code against it, add filters, and so on, similar to any other field in a table.

However, you cannot write to the timestamp field.

A typical use of the timestamp field is for synchronizing data changes in tables, when you want to identify records that have changed since the last synchronization.

For example, you can read all the records in a table, and then store the highest timestamp value. Later, you can query and retrieve records that have a higher timestamp value than the stored value.

To set up a timestamp field in a table

  1. In the development environment, open the table, and then add a field of the data type BigInteger.

Specify a name for the field, such as timestamp.

You can specify any valid name for field; you are not restricted to use timestamp.

  1. Open the field properties, and then set the SQL Timestamp property to Yes.

For demo purpose I am adding this field to table 330 – Currency Exchange Rate
Timestamp-1

Now when I run the table in RTC I see value automatically populated in this field.
Timestamp-2

I will come up with more details in my future posts.

Data Model, Development Tips, Excel, How To, PowerPivot

Set Data Categories for fields in PowerPivot

In order for Power View to dynamically create reports based on underlying data, such as location, fields that contain such data must be properly categorized.

Open the Excel Workbook we created in our earlier post. Create a Power View report

For the Olympics data, let’s specify the categories for a few fields.

  • In Power Pivot, select Hosts. Select the NOC_CountryRegion field. From Advanced -> Reporting Properties -> Data Category: click the arrow and select Country/Region from the list of available data categories, as shown in the following screen.

ExcelData-37

  • Return to Excel, and select the Power View sheet. Expand the Medals table in Power View Fields, and notice that the NOC_CountryRegion field now has a small globe icon beside it. The globe indicates that NOC_CountryRegion contains a geographic location, as shown in the following screen.

ExcelData-38

We’ll use that geographic location in an upcoming post. It’s time to save your work, review what you’ve learned, and then get ready to dive into the next post.

I will come up with more details in my next post. Till then Stay Tuned, Keep Learning & Practicing.

Data Model, Development Tips, Excel, How To, Power View, PowerPivot

Set Table Behaviour in PowerPivot

You can set the default table behaviour, which Power View uses to automatically create report labels for the table.

This becomes useful when you create visualizations from the same table, perhaps for many different reports.

Open the Excel Workbook we created in our earlier post. Create a Power View report

We use default table behaviour in the next few steps, so let’s set it now.

Open Medals Table in Data Model, select Advanced > Reporting Properties > Table Behaviour. A window appears where you can specify table behaviour.
ExcelData-33

  • In the Table Behavior window, the Row Identifier is the column that contains only unique keys and no blank values. This is often the table’s primary key, but not compulsory to be any other field which satisfy this property. You have to select a Row Identifier before making other selections in the window. Select MedalKey as the Row Identifier.
  • In the Keep Unique Rows section, select AthleteID.

Fields you select here have row values that should be unique, and should not be aggregated when creating Pivot Tables or Power View reports.
Note: If you have trouble with reports that don’t aggregate how you want them, make sure that the field you want to aggregate is not selected in the Keep Unique Rows fields.

  • For Default Label, select a key that should be used as a default report label. Select Sport.
  • For Default Image, leave the selection as [No Column Selected], since you haven’t added images yet. The Table Behavior window looks like the following screen.

ExcelData-34

  • On the Power View sheet in Excel, select the table you created in the previous post Set field defaults in PowerPivot
  • From the ribbon, select DESIGN -> Table -> Card.

ExcelData-35

  • The table you created changes into a collection of Cards; the data is the same, but the visualization of the data has changed. The table now looks like the following screen.

ExcelData-36

Notice that the Sport field is larger than the rest, and appears as a heading for each card. That’s because we set Sport as the Default Label in the Table Behavior window when we were in Power Pivot.

I will come up with more details in my upcoming posts. Till then Stay Tuned, Keep Learning & Practicing.

Data Model, Development Tips, Excel, How To, Power View, PowerPivot

Set field defaults in PowerPivot

When you set a default field set for a table, you can simply click that table in Power View, and the default set of fields is automatically added to a new report.

Open the Excel Workbook we created in our earlier post. Create a Power View report

In today’s post, we will learn how to set defaults for our workbook that will save our time when creating reports.

Steps to Create the Default Field Set for a table

  • Select the Medals table in Data View Mode from PowerPivot Manager.
  • From the Advanced tab, select Reporting Properties > Default Field Set. A window appears that lets you specify default fields for tables created using client tools such as Power View.
  • Select Sport, Event, EditionID, Athlete, and Medal in the left pane, and click Add -> to make them the default fields.

ExcelData-31

To see how this works, switch to the Power View sheet in Excel.

  • Click anywhere on the blank report canvas, to make sure you don’t have an existing visualization selected. Your Power View sheet currently only has one visualization, which is the map you created earlier in previous post. Create a Power View report
  • In the Power View Fields list, click the Medals table name. Power View creates a table and automatically adds the five default fields from the Medals table, in the order you specified, as shown in the following screen. Make sure you don’t click on the triangle beside Medals, if you do so the table simply expands, rather than adding a new table with default fields.

ExcelData-32

I will come up with more details on this topic in my upcoming posts. Till then Stay Tuned, Keep Learning and Practicing.

Data Model, Development Tips, Excel, How To, PowerPivot

Create a calculated field in PowerPivot

Open the Excel workbook which we used in our previous post on this topic. Olympics Excel Work book.

Select PowerPivot -> Manage

PowerPivot Window will open, If Calculation area not visible below table data as shown in below screen. Click Calculation Area button in Top Right Corner.

ExcelData-27

In the Calculation Area, select the cell directly below the Edition column. From the ribbon, select AutoSum > Distinct Count, as shown in the following screen.
ExcelData-28

Power Pivot automatically created the following DAX formula: Distinct Count of Edition:=DISTINCTCOUNT([Edition])

Additional calculations in AutoSum are just as easy, such as Sum, Average, Min, Max, and others.

Let’s calculate the percentage of all medals. In the formula bar, type the following DAX formula. IntelliSense provides available commands based on what you type, and you can press Tab to select the highlighted IntelliSense option. Percentage of All Medals:=[Count of Medal]/CALCULATE([Count of Medal],ALL(Medals))
ExcelData-29

When we return to Excel Sheet we can find these fields available in Medal Table. Shown in the right side of the screen above.

Let’s create a PivotTable from Medal Table. Our Pivot Table will be designed as below screen.
ExcelData-30

I will come up with more details inn my upcoming posts. Till then stay tuned, keep Learning and keep practicing.

Corfu Navision 2016, Development Tips, FILTERPAGEBUILDER, How To

Filter Pages for Filtering Tables using FILTERPAGEBUILDER

In C/AL code, you can use the FILTERPAGEBUILDER data type to create a filter page that enables users to set filters on multiple tables. Filter pages contains one or more filter controls, where each filter control can be used to set filters on a specific table. In the Microsoft Dynamics NAV client, filter pages are generated at runtime and run in a modal dialog box.

For demo purpose I have created a List page on Item Table. I have added below Variables and Code on Page.
filterpagebuiler-1
When I Run the Page, First Request page is popup to accept filters. Then my Item List Page is opened applying the filter I provided on the Request Page.
filterpagebuiler-2
FILTERPAGEBUILER Data Type Functions

ADDTABLE Function

Adds a filter control for a table to a filter page.

ADDRECORD Function

Adds a filter control for a table to a filter page as specified by a record data type variable.

ADDRECORDREF Function

Adds filter control for a table to a filter page as specified by a recordref variable.

ADDFIELD Function

Adds a table field to the filter control for a table on filter page.

ADDFIELDNO Function

Adds a table field to the filter control for a table as specified by the field number.

GETVIEW function (FilterPageBuilder)

Gets the filter view (which defines the sort order, key, and filters) for the record in the specified filter control of a filter page.

SETVIEW Function

Sets the current filter view, which defines the sort order, key, and filters, for a record in a filter control on a filter page.

RUNMODAL Function (FilterPageBuilder)

Builds and runs the filter page.

COUNT Function (FilterPageBuilder)

Gets the number of filter controls that are specified in the FilterPageBuilder object instance.

NAME Function (FilterPageBuilder)

Gets the name of a table filter control that is included on a filter page based on an index number that is assigned to the filter control.

Data Model, Development Tips, Excel, How To, PivotTable, PowerPivot, Report

Use hierarchies in PivotTables

Recall from my previous post Create a hierarchy in PowerPivot Data Model, We will continue from where we left our earlier post.

Now we have a Sports hierarchy and Locations hierarchy, we can add them to PivotTables or Power View, and quickly get results that include useful groupings of data.

Prior to creating hierarchies, you had to add individual fields to the PivotTable, and arrange those fields how you wanted them to be viewed.

In this post we will use the hierarchies created in the previous post to quickly refine our PivotTable.

Open the Excel workbook which we used in our previous post and Insert PivotTable as shown in below screen.
ExcelData-17

  • Add field in the PivotTable Medal from Medal Table in the FILTERS area, and Count of Medal from Medal Table in the VALUES area. Your nearly empty PivotTable should look like the following screen.

ExcelData-18

  • From the PivotTable Fields area, drag SDE from the Events table to the ROWS area. Then drag Locations from the Hosts table into the COLUMNS area. Just by dragging those two hierarchies, your PivotTable is populated with a data, all of which is arranged in the hierarchy we defined in the previous steps. Your screen should look like the following screen.

ExcelData-19

  • You can expand any of those Sports in the PivotTable, which is the top level of the SDE hierarchy, and see information in the next level down in the hierarchy (discipline). If a lower level in the hierarchy exists for that discipline, you can expand the discipline to see its events. You can do the same for the Location hierarchy, the top level of which is Season, which shows up as Summer and Winter in the PivotTable.

ExcelData-20

ExcelData-21
By dragging those two hierarchies, you quickly created a PivotTable with interesting and structured data that you can drill into, filter, and arrange.

I will come up with more details and other options on this topic in my upcoming posts. Till then keep learning and practicing.