Development Tips, Excel, How To, Jet Reports, Office Integration, Report

Using NL( Lookup ) in Jet Reports Part-3

We have discussed regarding Lookup in my previous post. If you missed can find link here.

Using NL( Lookup ) in Jet Reports Part-1.

Using NL( Lookup ) in Jet Reports Part-2.

Continuing with more advanced usage I am here below.

Another useful feature of the NL(“Lookup”) function is the ability to specify how many records Jet Reports will go through in order to create a list of values.

By default, Jet Reports uses the value that is set for Maximum Lookup Records Scanned on the Jet Reports Options form. The default is 1,000 records. If the number of desired records to be searched is larger than this setting, the “ScanLimit=” keyword can be utilized.

To apply a scan limit, “ScanLimit=” must be placed in one of the FilterField parameters and then the desired number of records to be searched will be placed in the associated Filter parameter.

To create a Lookup function that will return all of the G/L Account Numbers in the first 5,000 records of a G/L transaction table, the function would look like this:

=NL(“Lookup”,”G/L Entry”,”G/L Account No.”,”ScanLimit=”,”5000”)

The NL(“Lookup”) function normally returns all values (for the particular field) that are present in the table specified.  For fields defined in NAV as “Option” fields, it may sometimes be desirable to display *all possible* value – regardless as to whether those values are present in the table or not.  For this, a useful feature is the “SmartLookup=” option (available in Jet Essentials 2012 R2 and later).

For example, the function:

=NL(“Lookup”,”Item Ledger Entry”,”Entry Type”)

Might provide a Lookup window that may not list all options depending upon data in the table.

By adding the “SmartLookup” option we could get a list of all options defined as option to that field.

 =NL(“Lookup”,”Item Ledger Entry”,”Entry Type”,”SmartLookup=”,”TRUE”)

Lookup-10

Stay tuned for more details in my upcoming posts

Development Tips, Excel, How To, Jet Reports, Office Integration, Report

Using NL( Lookup ) in Jet Reports Part-2

We have discussed regarding Lookup in my previous post. If you missed can find link here.

Using NL( Lookup ) in Jet Reports Part-1.

I am continuing with more advanced usage here below.

In some instances it is also desirable to base the values that are displayed in one NL(“Lookup”) function on the results that were selected in another NL(“Lookup”) function.

An example of this could exist in a Sales Report. The viewer will have the ability to select a Salesperson Code to run the report for, and will also be able to specify Customer Numbers in order to filter the report further.

If only one Salesperson Code is selected, however, it may be undesirable to display Customer Numbers that are associated with other Salesperson Codes.

In this instance, two NL(“Lookup”) functions will be used, with the Customer Number filtered by the Salesperson Code so that the values are related. The first NL(“Lookup”) function, which will allow the selection of the Salesperson Code, will look like this:
Lookup-6

Lookup-7

The next NL(“Lookup”) function will give the viewer the ability to select from a list of Customer Numbers, but it will be filtered based on the Salesperson Code that was previously selected. This is done but inserting a normal filter into the function and referencing the cell containing the Salesperson Code that was previously selected by the viewer.

This addition would make the report look like this:
Lookup-8
After selecting Salesperson Code Filter when we open Customer List it will show lookup as below:
Lookup-9

Customer List is filtered out with Salesperson Code we selected using Salesperson List Lookup.

Will come up with more details in my upcoming post, stay tuned for more details.

Development Tips, Excel, How To, Jet Reports, Office Integration, Report

Creating Simple List Report in Excel Using Jet Reports Part-2

In my previous post we saw how to create simple report in excel using Jet Report.

If not seen please refer it before you continue with this post, here is the link for same:

Creating Simple List Report in Excel Using Jet Reports Part-1

Using NL Lookup Part-1

Here we will start from where we left in previous post.

We will add one more sheet in Report we created in our previous post, and name it is as Option, where we will define all of our Filters.

Our Option sheet will look as below:
JetSimpleReport-7
Here we have created 3 Filters Customer No., Credit Limit LCY & Balance LCY.

Next Step will be to apply this Filter provided by user at runtime to the Report.

Return to your Report Sheet and edit the NL Function used to retrieve Rows from Customer as below:
JetSimpleReport-8
(*) in filter denotes all, in other words no Filter.

Now let see the Filter Sheet how it behaves when we run the report.

When we run the report first Report option is shown, where we will give our Filters:
JetSimpleReport-9

Here I am giving below filters:

Customer No. Filter                         *              Include All Customers

Credit Limit (LCY) Filter                  0              All rows with Credit Limit as Zero

Balance (LCY) Filter                      >0             All rows with Balance value greater than Zero

The output of the report should be as below:

JetSimpleReport-10

Stay tuned for more details in my future posts.

I will explain more about commands, filters, functions, lookup etc.…

Development Tips, Excel, How To, Jet Reports, Office Integration, Report

Using NL( Lookup ) in Jet Reports Part-1

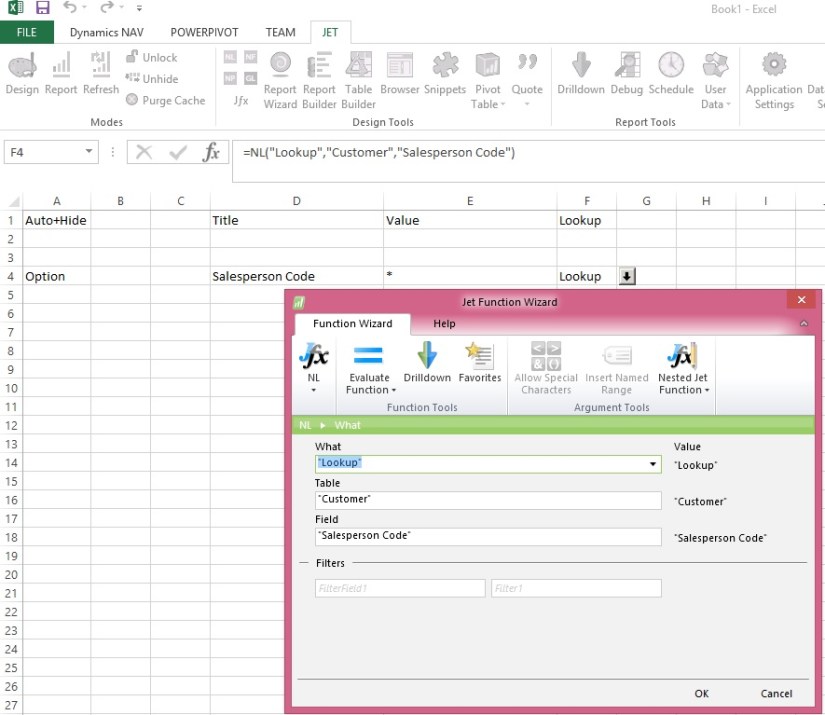
The NL(“Lookup”) function can be used to provide Lookup to the Users so that he can select from a specified list of values when setting their report filters. This will allow them to see the list of options available to them in regards to a particular report filter.

The most common (and basic) use of the NL(“Lookup”) function is to simply pull a list of values from the database.

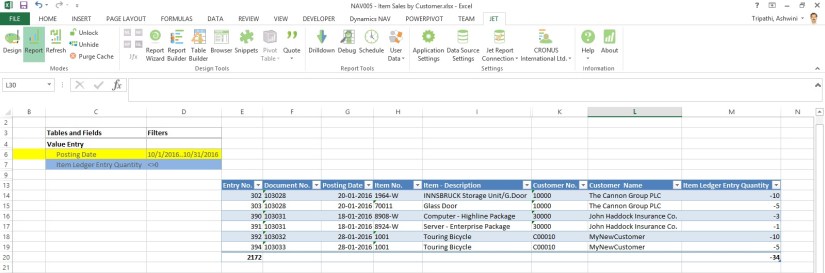
For example, if a list of customer numbers (“No.”) from the “Customer” table is desired then the function would look something like this:

=NL(“Lookup”,”Customer”,”No.”)

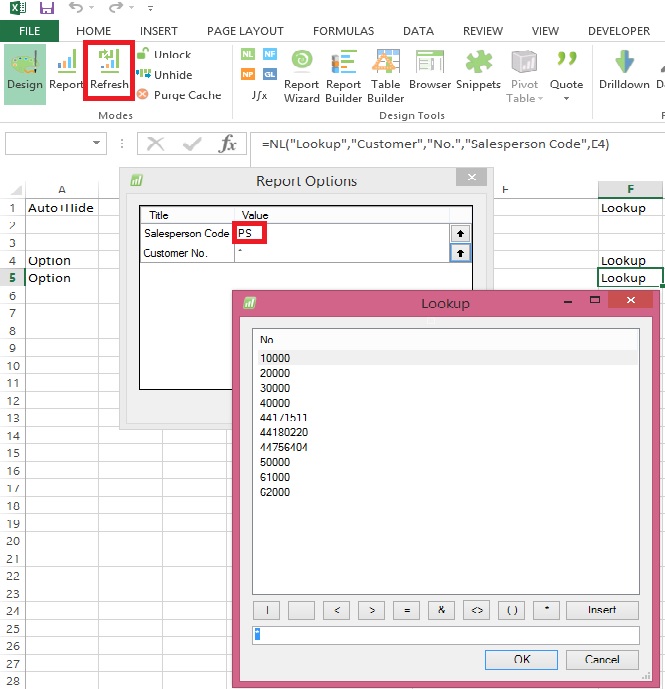
The resulting lookup that the user sees would be:

Lookup-1

It is also possible to allow the user to see more than one value from a particular table. This can help the user to make a choice more easily by displaying additional details about the values returned.

Multiple fields can be displayed by placing them in an array. This is accomplished by placing the list of fields to be displayed, separated by commas, in the Field parameter and surrounding it with curly braces.

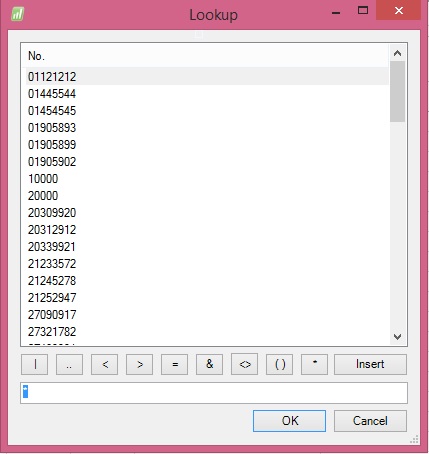
If the fields to be shown are the “Name” and the “Country/Region Code” associated with each customer “No.”, the resulting function would look something like this:

=NL(“Lookup”,”Customer”,{“No.”,”Name”,”Country/Region Code”})

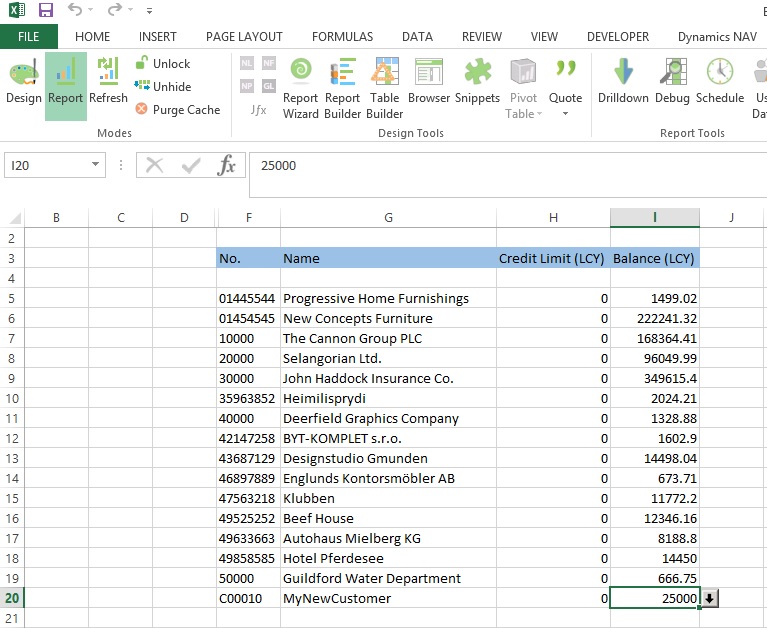
The resulting lookup would be:

Lookup-2

NOTE: The first field in the array is the field that will be returned by the Lookup form.

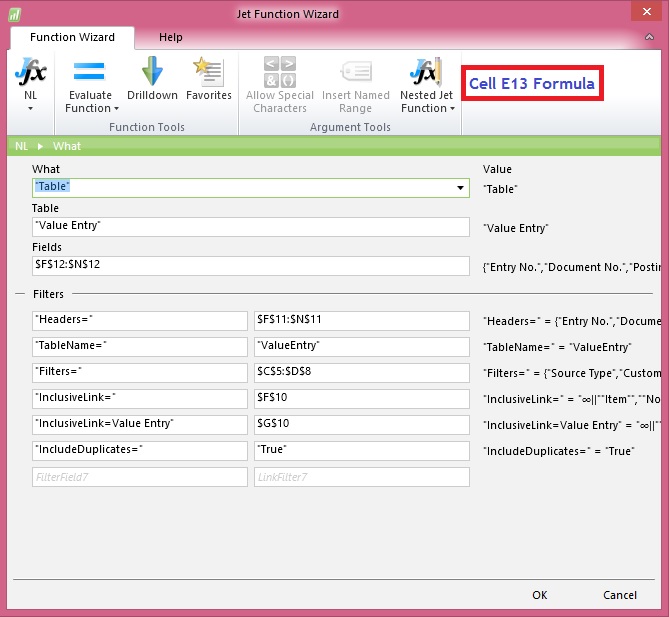
In addition to selecting multiple fields to be displayed in the list, it is also possible to customize the headers, that appear at the top of the Lookup window. This can be done by placing “Headers=” in one of the FilterField parameters of the NL(“Lookup”) function.

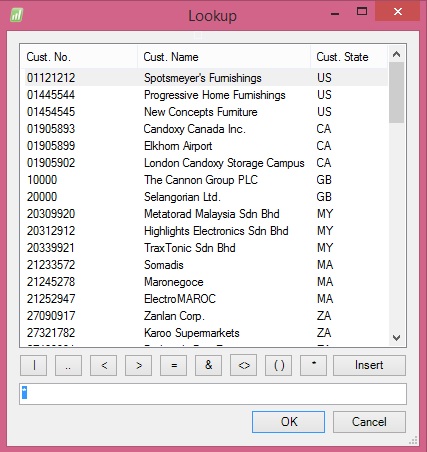
For example, instead of the field names appearing as “No.”, “Name”, and “Country/Region Code”, it has been decided that they should be displayed as “Cust. No.”,”Cust. Name”, and “Cust. State” to the user.

To do this, “Headers=” will be added in one of the FilterField parameters, and the desired names will be placed in the associated Filter parameter. The function should look like this:

=NL(“Lookup”,”Customer”,{“No.”,”Name”,”Country/Region Code”},”Headers=”,{“Cust. No.”,”Cust. Name”,”Cust. State”})

The resulting Lookup window would now appear as:

Lookup-3

In addition to returning a list of values from the database, it is also possible to manually specify the values that will be returned.

This allows you to present the user with a list of values that are not stored in your database. The syntax that will be used is slightly different. Since data is no longer being returned directly from the database, the Table parameter is no longer used to specify the table that the information will pull from. Instead, an array containing the values to be displayed is placed in the Table parameter of the Lookup function. The Field parameter will then contain the list of column headers of the Lookup window.

To create an NL(“Lookup”) function that will display “East”, “West”, “North”, and “South” for Directions, the function will be:

=NL(“Lookup”,{“East”,”West”,”North”,”South”},”Direction”)

The resulting lookup window would now be:
Lookup-4
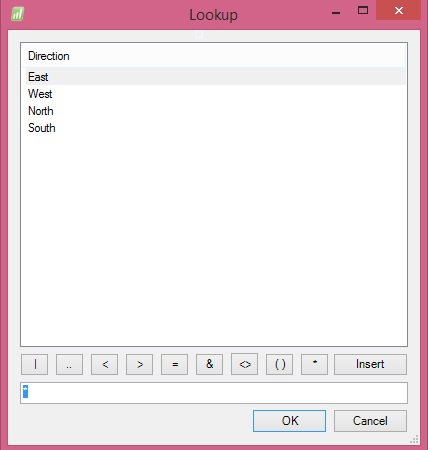
NOTE: It is important to place the field name that will be displayed at the top of the Lookup window (in this example “Direction”) in the Field parameter. Omitting this will not display any values in the Lookup Window.

In addition to placing the values in the NL(“Lookup”) function itself, a cell reference can also be used. The following example will display the exact same result as the previous example, but the values are specified by a cell reference instead of text.

It is also possible to display multiple columns in the Lookup Window by utilizing cell references. To achieve this, another column of values will need to be inserted next to the values that we are already displaying. Once this is done, the cell reference in the NL(“Lookup”) function will also need to be expanded to encompass both columns of data. Since multiple columns are now being specified, names for these columns will also need to be defined in the NL(“Lookup”) function as well. This is done by using the array syntax that was described above in order to specify the field names in the Field parameter, in this case “Direction” and “Description”.

=NL(“Lookup”,F5:G8,{“Direction”,”Description”})

Below is an example of what this would look like:

Lookup-5

Will come up with more details in my next post on this.

Stay tuned for more details in my upcoming post.

Development Tips, Excel, How To, Jet Reports, Office Integration, Report

Creating My First Report Using Jet Reports

Today I will discuss, how to create reports in Excel using Jet Reports.

Below links will be helpful to refresh what I have shared till now:

Installing Jet Express for Excel – Navision 2015

Installing and Publishing the Jet Business Objects on the Microsoft Dynamics Server

Publishing the Jet Data Source Codeunit to the Web Service

Enable SOAP Services and identify connection parameters

Configuring a Data Source in Jet Express

Using Jet Report NL Function

Using Jet Report NF Function

Using Link in Jet Reports

We will be using NL Functions.

Also we will introduce few Arguments for NL Function.

Below Table describes the same:

Parameter Argument Description
What
“Link” Returns a string value that can be used as a filter in another NL function
“LinkField” Returns a string used to retrieve a field from a link table in an NL(Table) function.
“Table” Creates an Excel table object based on the field values returned. Leaving the Field argument blank returns all fields. Use a Field Cache to return multiple fields.
FilterField
“Headers=” Overrides field headers with the array of headers specified by the Filter argument. For use with an NL(Table) or NL(Lookup) function.
“TableName=” Specifies the name to use for the Excel table object created by NL(Table) with the name in the Filter parameter. Use this to refer to the table by name from a Pivot table.
“Filters=” Specifies a set of filters for the query with an array of filters specified by the Filter argument.
“InclusiveLink=” Links the primary table to the one specified by the Filter argument for the purpose of retrieving data.
“IncludeDuplicates=” When the value of the Filter argument is TRUE, specifies that all matching records from the source data will be included in the NL(Table) results.

We will design below report to see how Jet Report is designed.
FirstJetReport-1

Below describes the Formulas need to be inserted in respective cells.

Make sure you add ‘=’ in front of Formulas as defined in Data Type Column.

Cell Reference Formula Data Type
F10 NL(“Link”,”Item”,,”No.”,”=Item No.”) Formula
G10 NL(“Link”,”Customer”,,”No.”,”=Source No.”) Formula
F11 Entry No. Text
G11 Document No. Text
H11 Posting Date Text
I11 Item No. Text
J11 Item – Description Text
K11 Gen. Prod. Posting Group Text
L11 Customer No. Text
M11 Customer   Name Text
N11 Item Ledger Entry Quantity Text
F12 Entry No. Field Names
G12 Document No. Field Names
H12 Posting Date Field Names
I12 Item No. Field Names
J12 NL(“LinkField”,”Item”,”Description”) Formula
K12 NL(“LinkField”,”Item”,”Gen. Prod. Posting Group”) Formula
L12 Source No. Field Names
M12 NL(“LinkField”,”Customer”,”Name”) Formula
N12 Item Ledger Entry Quantity Field Names
E13 NL(“Table”,”Value Entry”,$F$12:$N$12,”Headers=”,$F$11:$N$11,

“TableName=”,”ValueEntry”,”Filters=”,$C$5:$D$8,”InclusiveLink=”,$F$10,

“InclusiveLink=Value Entry”,$G$10,”IncludeDuplicates=”,”True”)

Formula

Although you can directly key in the text for NL commands and functions as formula. Below I show the Function Wizards for better understanding and how to use the same. All marked as Formula in above Table.

For Rest marked as Text or Field Names, you can key them directly in respective cells.
FirstJetReport-2
FirstJetReport-3
FirstJetReport-4
FirstJetReport-5
FirstJetReport-6
FirstJetReport-7

The output of Report will as below:
FirstJetReport-8

Stay tuned for upcoming posts for more detailed information.

I understand above example is bit complex I will come up with more simple and basic reports for beginners in my upcoming posts.

Report

Word Document Reports and Custom Layouts

Reporting functionality has been greatly improved in Microsoft Dynamics NAV 2015 by adding support for defining report layouts in Word, and enabling end users to create custom RLDC and Word layouts for their reports. These two features make it easier to create visually pleasing document reports, as well as allow end users to modify reports to their liking with as little partner involvement as desired.

Today I am sharing again all the posts from earlier archive, if you missed you can find all of them below.

Soon I will come up with more posts on this topic. Till then go through below links and develop your skills so that we can take up few more complex ones.

  1. How many types of Layout is supported in NAV 2015?
  2. How to. Specify the Default Built-in Report Layout
  3. Import and Export a Word Report Layout
  4. Add Fields from a Report Dataset to a Word Report Layout
  5. Adding Image Fields
  6. Removing Label and Data Fields
  7. To create a Word report layout for a report
  8. Designing Report Layouts from the Microsoft Dynamics NAV Development Environment
  9. Creating my first Word List Report in Navision 2015
  10. To modify the Word report layout
  11. Creating Custom Word Layout for Document Reports in Navision 2015
  12. Creating Word Mail Merge Report in Microsoft Dynamics Navision 2015
  13. The New Report Scheduling feature for end users running reports in Microsoft Dynamics Navision 2015