
Using BI to Get the Most out of Account Schedules in NAV
Video-1
Video-2
Using BI to Get the Most out of Account Schedules in NAV
Video-1
Video-2
In March I have written few posts on Power BI keeping in mind who are beginners.
In case you have missed here I present the link to all those posts here below.
Introduction to Power BI and Creating Report from Excel Data, Local Files.
Microsoft Power BI – Part – II
Introduction to few Features of Power BI
Microsoft Power BI – Part – III
Power BI Desktop, Creating Dataset & Reports from In Premise Database installation
Microsoft Power BI – Part – IV
Power BI Gateway usage
Scheduling Refresh of Dataset & Report created using In Premise Database
Microsoft Power BI – Part – VI
Power BI Microsoft NAV Content Pack
Microsoft Power BI – Part – VII
Power BI Mobile App
Microsoft Power BI – Part – VIII
Power BI Content Pack
Microsoft Power BI – Part – IX
Power BI Publisher for Excel
ANALYZE IN EXCEL
I will come up with more features and other important details in my future posts.
You can find lots of materials on Power BI here : https://powerbi.microsoft.com/en-us/
https://powerbi.microsoft.com/en-us/learning/

Continuing from my previous post, if you have not seen yet please check it out it will help you continuing with this post.
You can check:
Microsoft Power BI – Part – II
Microsoft Power BI – Part – III
Microsoft Power BI – Part – IV
Microsoft Power BI – Part – VI

Open the powerbi.com and go to download link of mobile app : https://powerbi.microsoft.com/en-us/mobile/
I have Android so I am selecting Google Play, you select appropriate link as per your mobile OS.

Login with your Google account and choose Install.
Alternatively you can install from your mobile browser.

Search for Microsoft Power BI and Install the app.

Once the App is Installed Open the App.

From Home Screen Select Get Started.

Give your Login details as registered by Power BI and Sign In.

Complete your credentials and Sign In.
Once you are Login, Choose Start Exploring.

You will get all available Dashboard on your Power BI Portal.

Now you can browse and see your Reports pinned on your Dashboard.
Application have other features need to be explored, different version and on different OS platform you may find features bit different. The app is getting updated from time to time including more features and performance issues.
I will come up with more details on this topic in my upcoming posts.
Till then keep exploring and Learning from different sources available online via blogs and online help on powerbi.com.
Continuing from my previous post, if you have not seen yet please check it out it will help you continuing with this post.
You can check:
Microsoft Power BI – Part – II
Microsoft Power BI – Part – III
Microsoft Power BI – Part – IV
Today we will discuss how to use Power BI Content Pack:

Few things to keep in mind to get report Generated Successfully.
Point-1 You have required objects for this content pack in your database.
If you are using 2016, you can skip this as these objects are available in 2016. If you are using 2015 or 2013 then export these objects from 2016 and import in your database.

Above Pages will be present in your previous version of database, you need to import the 6 Query objects. These are necessary as these are used as source to fetch data from your data base by this content pack.
Point-2 Web Services need to be published.

Make sure you use same name for Services as you may get error while connecting and refreshing/ fetching data using this content pack.
Point-3 SSL port and web address is used to access the services.
https is used as this will not work on http.
Self-signed certificate will not work which we use for test purpose for publishing services and testing. It will throw Trusted relationship connection type error. If you have one use the same instead using Self-signed certificate.
No worries, don’t be disappointed. I will give you tip to overcome this requirement just follow as below:
You may remember that in our previous post we installed and used Power BI Gateway, actually we got a Trusted Certificate which we can use for this purpose.

Open IIS Manager on your system.

Select Serve/ Machine in Left Navigation Tree and Select Server Certificates.

Locate the Data Management Gateway SSL Certificate, this got installed when you installed Gateway. Double click to open the Properties of the certificate.

Switch to Details Tab, Scroll down to find Thumbprint, and Copy the Thumbprint and paste to Notepad finally remove all space leading, trailing and any in between.
It should look like above right bottom corner notepad window no space in Thumbprint signature.
Copy this Value and use as Thumbprint in you Navision Service.

Select Your Service.
Edit.
Paste the Certificate Thumbprint.
Make Sure SSL is Enabled for your OData Services.
Save.
Restart the Service.
We are done with the basic requirements now let us connect using Power BI Miscrosoft Navision Content Pack.
Now Login with your credentials to Power BI.

From Left bottom corner Select Get Data.

Select Get Data from Services.

Scroll to find Microsoft Dynamics NAV Services and Select Connect.

Copy your OData Service URL. Make sure you remove Service name from the URL and trailing ‘/’ after company name from the URL.
Select Next.

Select the Authentication Method and then Sign In.

Wait for few minutes you dataset will be loaded.
As a result you will get: Dataset, Report & Dashboard ready for you in few minutes depending upon the data volume and connection speed.

The report and dashboard view will be as per the available data in your database.
Hurray!!!
You are done with your practice session.
This is a Holi Gift for my reader from my side.
I will come up with more features explanation and other Tips & Tricks in my upcoming posts, till then keep practicing and learning from blogs and helps available online.
Continuing from my previous post, if you have not seen yet please check it out it will help you continuing with this post.
You can check:
Microsoft Power BI – Part – II
Microsoft Power BI – Part – III
Microsoft Power BI – Part – IV
Today we will discuss how we can schedule refresh for Dataset for Report which we published in our previous post.
We can schedule Refresh for our database which is in our premise.
In Previous post we saw how to enable Gateway to refresh the dataset. This Gateway must be running else we won’t be able to refresh our data from our database. We can Schedule the Refresh but however we can refresh the same whenever required as we saw in our previous post.
It very easy to get it done.
Step -1 Run your Gateway on the server so that Online Power BI can communicate with your server and request for updated data. This should be kept Running All the time just live any service keep running on your Server.
Step-2 Login to Online Power BI at PowerBI.com, using your credentials.
Step-3 Configure Refresh Schedule
For Step 1 & 2 please refer to earlier posts in this series, Link on top of this post.
We will discuss Step-3 here.
Once you are Login to the system, Locate the Dataset you published in our previous post.
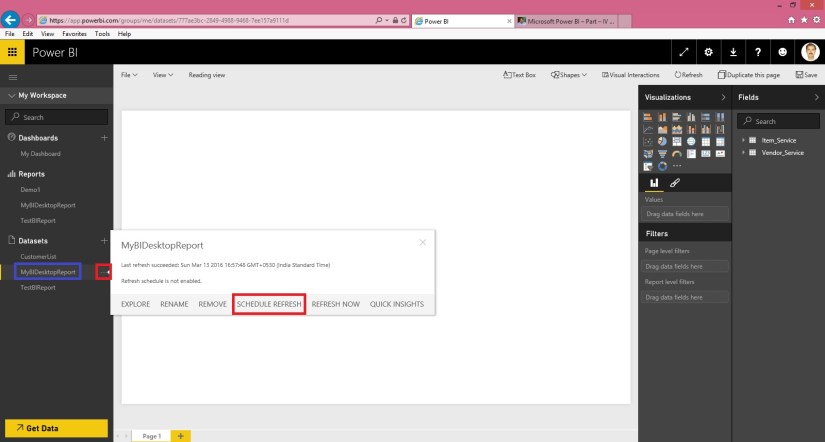
Click on the three dots next to the Dataset name & choose Schedule Refresh from the resulting Menu.

Here the required information is self-explanatory, fill in the details as per the requirement and Apply.
Make some data changes in your database and test if it reflects in your Report.
Meet you again via my next Post soon.
Till then keep practicing and learning about Power BI through available Blogs, Help available online with PowerBI.com.
Continuing from my previous post, if you have not seen yet please check it out it will help you continuing with this post.
You can check:
Microsoft Power BI – Part – II
Microsoft Power BI – Part – III

In our previous post we publish Report from our BI Desktop which uses data from our in premise database. To keep our data sync to our report we will require provision via which our report is connected to our database.
Gateway will be useful for this purpose.
Let me make you clear the data update to report is not real time in fact it is scheduled but can refresh anytime to get updated data on the report.

When you launch Power BI Gateway, you get above home screen. Login with your credentials.
If you are doing it for first time it will ask you to define the name for your Gateway as in my case it is Ash_TecturaGateway.

Make sure you don’t close this window else you will not be able to sync your data. This should remain connected all the time.
Minimize this window and keep it running, preferred this should be on the server itself, as local machines can be closed and accidently this may get closed.
Once you are done, Next step will be to add this Gateway to your Online BI account, so that it can be used to sync your data, as scheduled or when required.
Sign to your account using your credentials to tour online BI on PowerBI.com.

From settings choose Manage Gateways.

Provide the name that you provided in Power BI Gateway on your local machine.
Provide Data Source type as OData
Provide same URL one you provided to your Report in Power BI Desktop.
Key in the Credential Type as in my case I am using Windows.
Provide your credentials for the connection.
Once you are done it will show you the status, both the screen should be Online, You are good to go.
Additionally you can add users and Administrators to whom you wish to grant access to publish and manage reports using this Data Source.
Now your data source and Gateway is configured for sync.

This shows your Gateway is connected and now your data source can be synced with the in premise database.
Now let’s check quickly if our connection is working.

From your Left Navigation Pan, Select 3 dots next to your Data Source, and from resulting menu choose Refresh Now.
If there is no connection issue or Credentials issue your data will be refreshed, else you need to ensure there is no gap in connection.
I will come up with more details and how to schedule Refresh in my upcoming post.
Till then keep practicing and learn more using online help and Blogs available on PowerBI.com site itself.
If you have not seen please check it out it will help you continuing with this post.
You can check:
Microsoft Power BI – Part – II
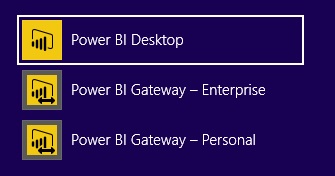
If you remember in our first post of this series we have downloaded an installed 2 Component/Tool
Today we will discuss and explore Power BI Desktop. It allows you to create the reports from in premise database and create visuals as we saw in our previous posts.
When you launch Power BI Desktop application opens as below:

Which more or less looks like one we saw online PowerBI.com.
Let’s try building one simple report using this tool.
Step-1 We will require some services to be published before we can access data from our in premise database.
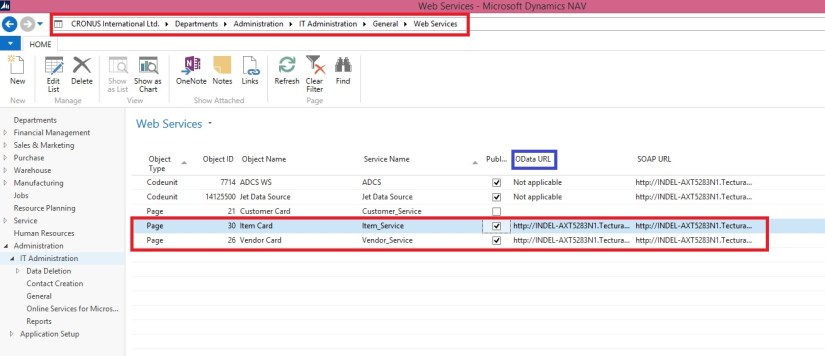
For my example I have published two pages Item Card & Vendor Card as a Web Service.
We will use OData URL to fetch data.
Step-2 Launch Power BI Desktop

Step-3 Connect our Data source to create our reports.
Select Get Data from the Home Screen.
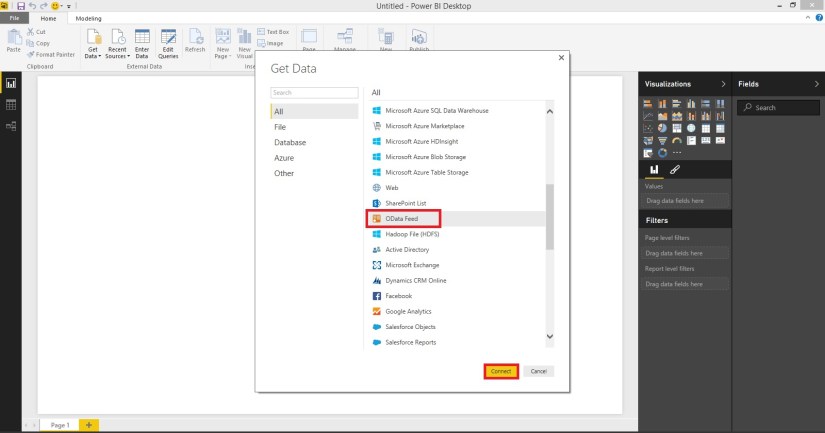
Copy the OData URL from the Web Service Page, in my case: http://INDEL-AXT5283N1.TecturaCorp.net:8048/DynamicsNAV80/OData/Company(‘CRONUS%20International%20Ltd.’)/Item_Service
Please take up to Company Name no Service Name required, it will list you all the services exposed from your database installation. In above remove the service name Item_Service from the URL.
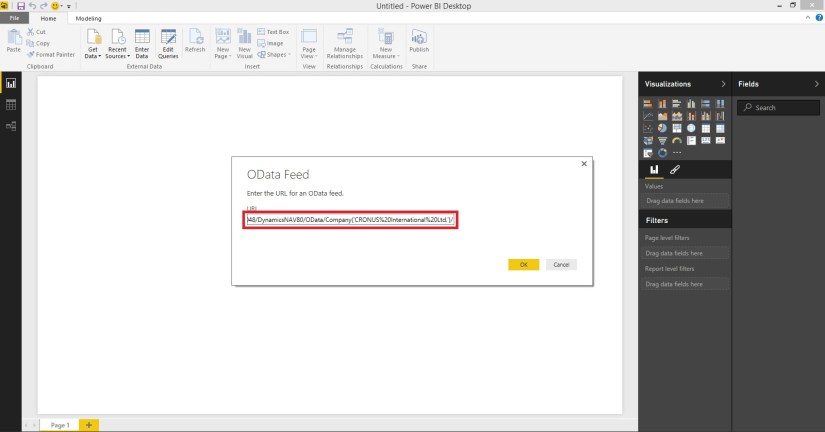
On selecting OK you will get list of all Services available in form of Single Query.
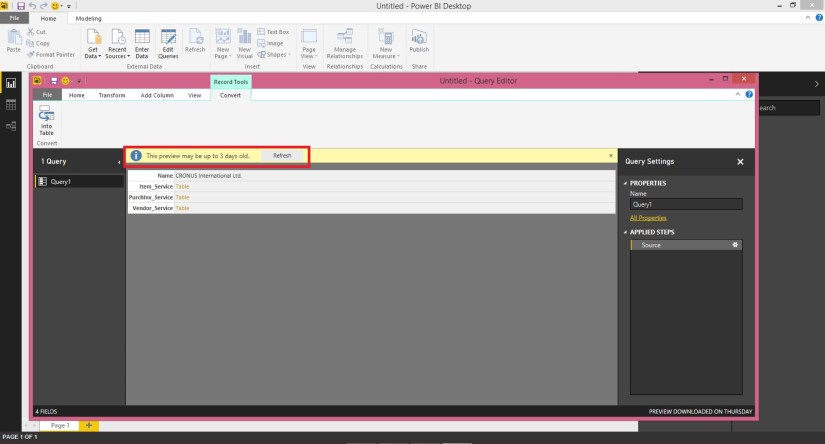
If you notice sometimes you may not get the latest list of services available, reason the connection is not refreshed. See the highlighted part in above screen.
Refresh the connection to get latest list of services available.
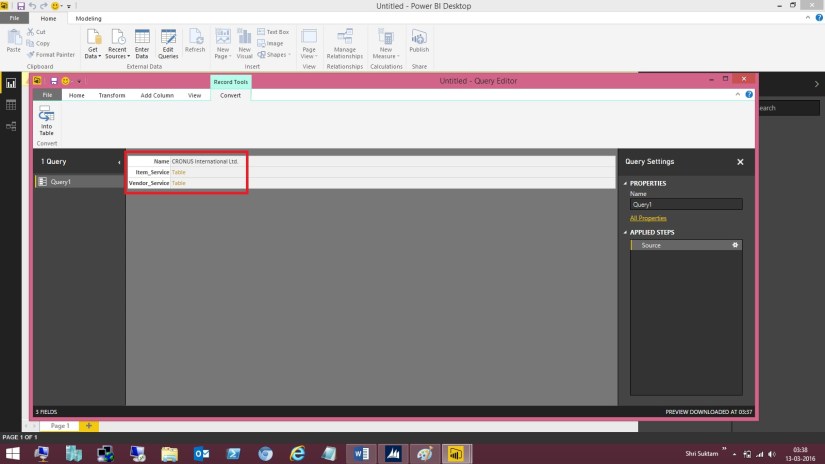
In above screen show us the currently available services which we can use for creating our report/ visuals.
Step-4 Add available tables to our Dataset.

Right Click on the Table Link and choose “Add as New Query”
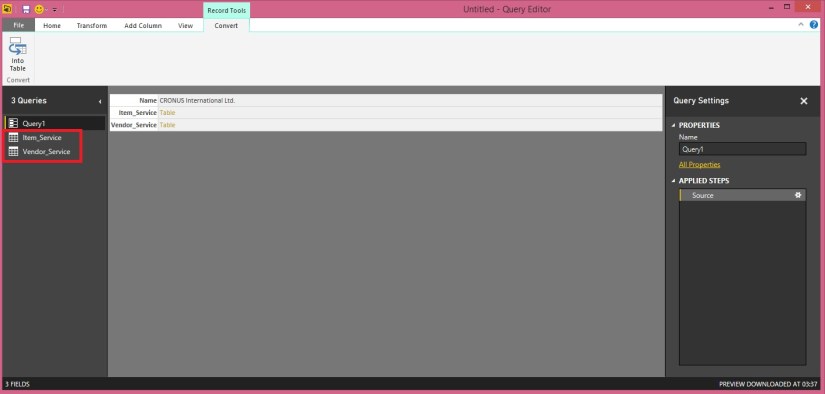
Once you add you can find Table Query in the Left Navigation Bar.
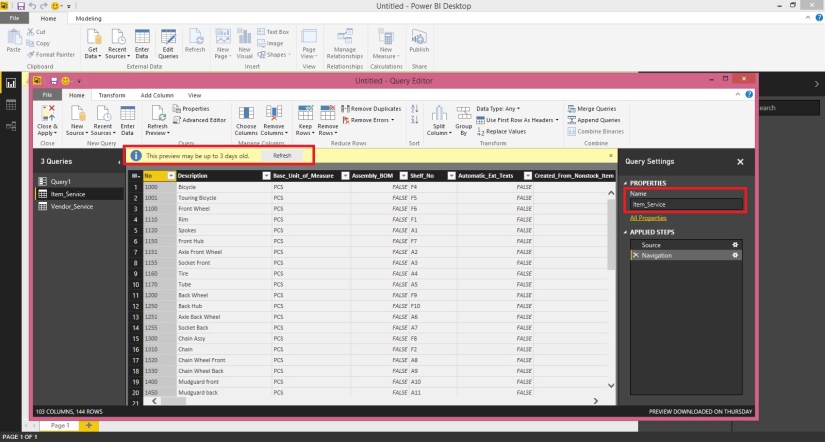
You can Browse the Table from the Left hand Navigation Bar and change its Name if required in the Right side “Query Settings”. On the Top of the Query you may find information if available data is old, you can Refresh it to get the updated one.
Here you can perform other operations too to tweak the table as per the requirement.
You can Add new columns deriving data from existing columns using formula and other available methods. You can drop unnecessary columns etc. We will look into same in future posts.
For now we will remove some additional columns which got added due to service.
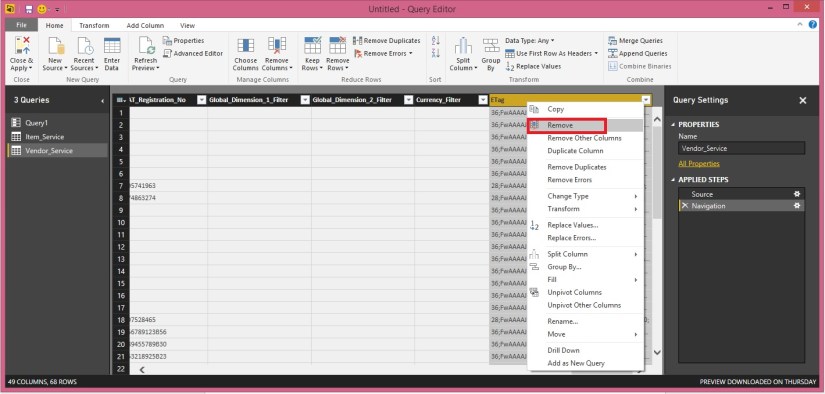
Select the column Right Click and choose Remove.
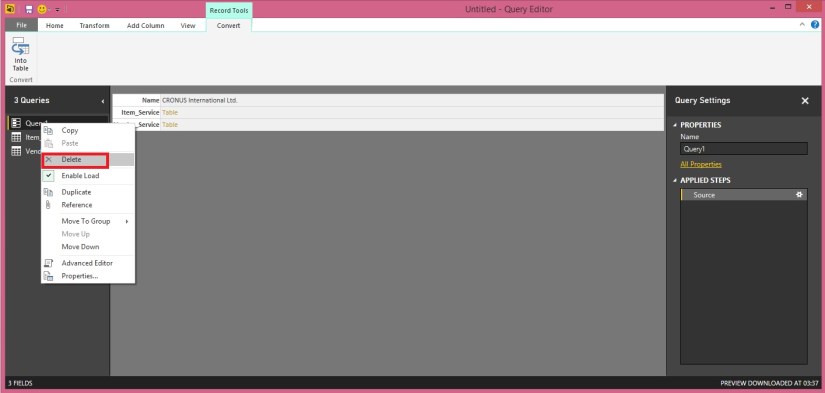
Finally we will remove the Source Query created after connecting to OData, Right Click to the Query and choose Delete.
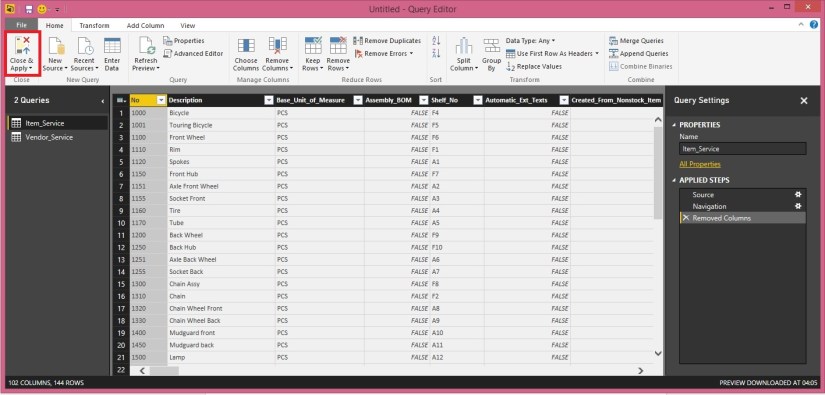
As a Final to this Step we will choose Close & Apply from the Top Left Corner Tool Bar.
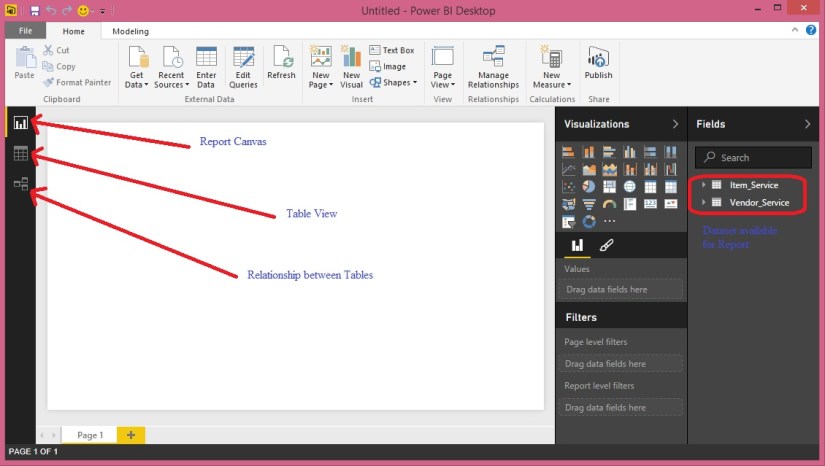
You will be returned to main Report Builder Window.
This screen is similar to one we saw while Online Power BI window.
Step-5 We will build Relation between our tables added above.
Let us build the Relation between the Tables we selected.
To define the Relationship Select Relationship view from the Left Navigation Bar.
You will see both the Tables in the Relation Window.
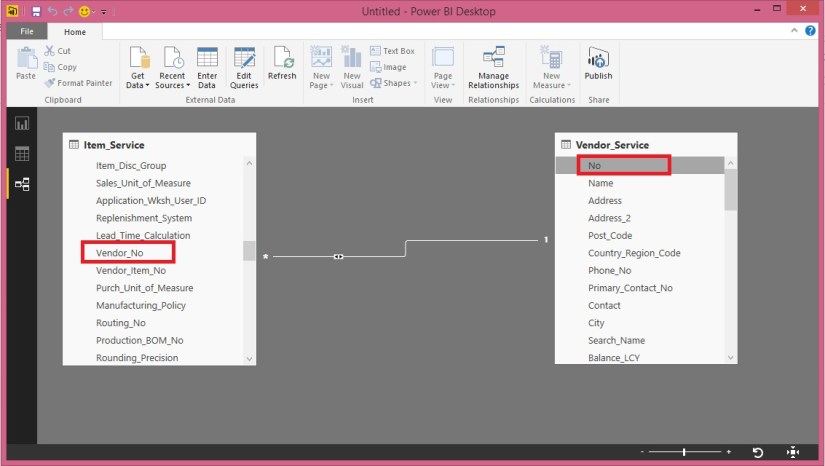
To define relation Click on Vendor No field in Item Table and Drop on No field of Vendor Table.
You will see Many to One Relationship is established between these two Tables. For now we will use this only and come in more details of Managing Relationship in future posts.
Step-6 Create our Report/ Visuals
Return to Report Canvas and add few Fields as we did while our First report using Online Power BI.
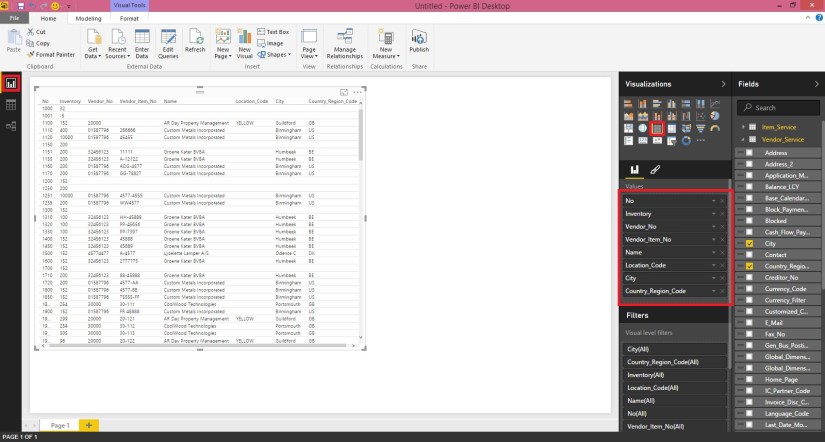
For my example I have added Item(No, Inventory, Vendor No, Vendor Item No) Vendor(Name, Location, City, Country Region Code).
Rest I leave up to you how you further categorize and Visualize the report. My objective was to demonstrate how you can create Reports in BI Desktop Tool using your in premise Navision Database installation.
Step-7 Save my Report
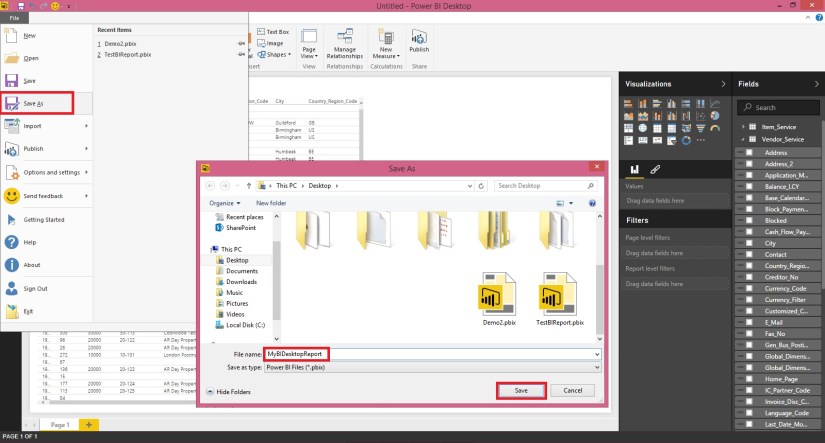
Save the Report *.pbix which we can access to modify report in future if required.
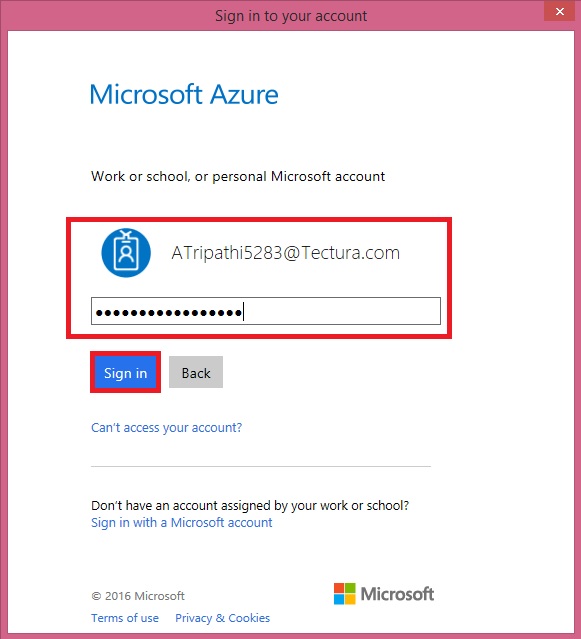
Step-8 Login to PowerBI Online
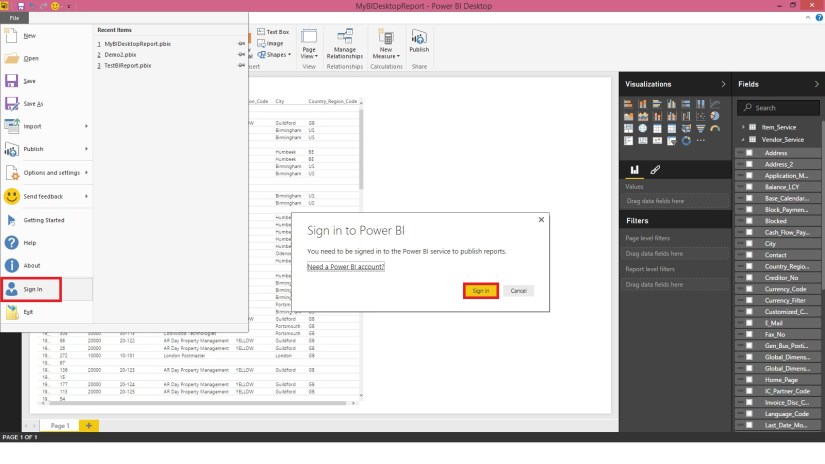
You will require credentials to your PowerBI online to connect.
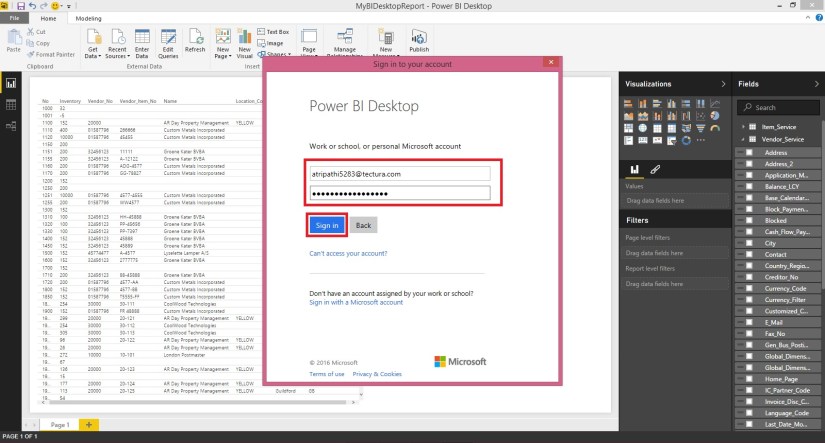
Provide your credentials and Sign in.
Once you successfully sign in to your account you can now proceed with next step.
Step-9 Publish the Report to Online Power BI

Once your Report is published successfully you will get below screen
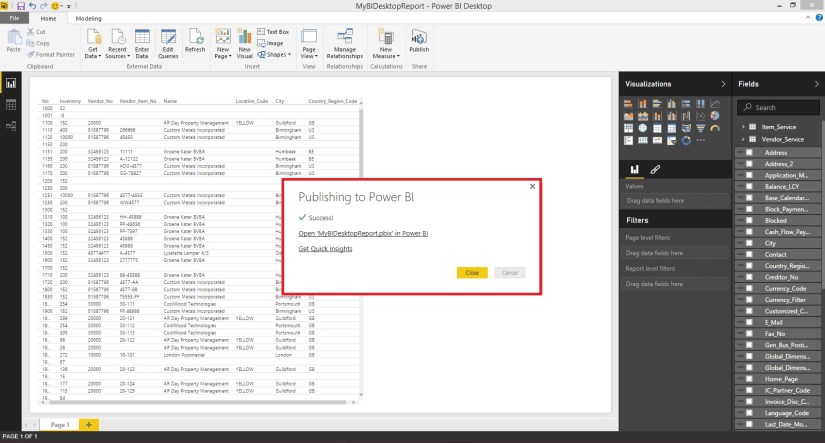
Step-10 Verifying the Report on PowerBI.com

Sign in using your credentials to PowerBI.com
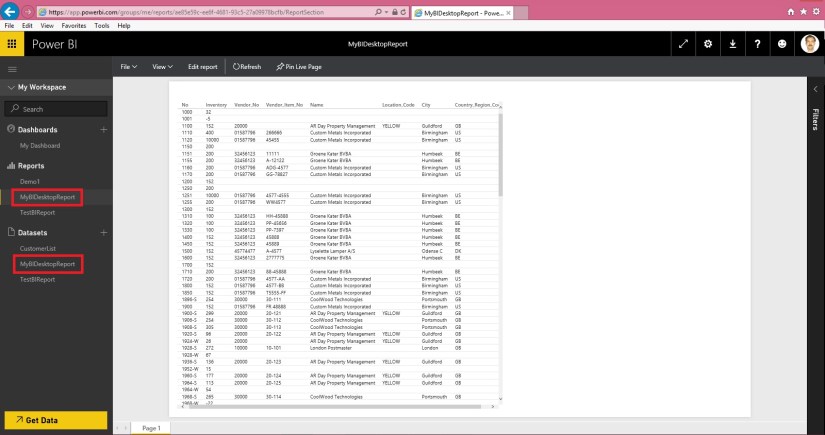
Great, the report we published from BI Desktop is now available Online.
That’s all for today.
Truth is we have created the Report using in premise database, it should be in sync with latest data from our database. But this will not at this moment.
In our next post we will work on how to keep the data of this dataset in sync with the data from our in premise database.
Till then keep exploring and learning new features available with Power BI.
Dear Friends I will be continue from my previous post where we left. If you have not seen please check it out it will help you continuing with this post. You can check here.
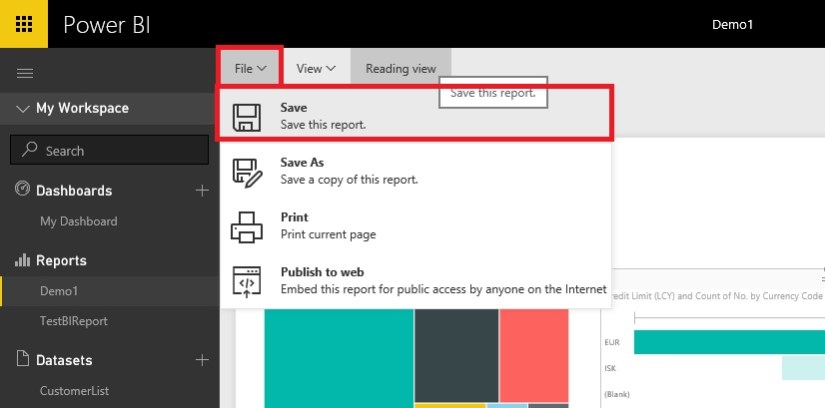
Let’s save the report we created in previous post and continue their after exploring more features.
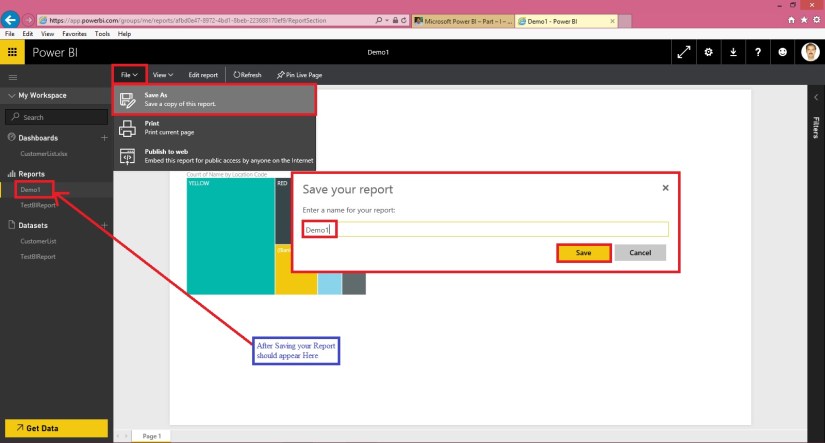
Create a Dashboard and Pin our Visuals.
To create a Dashboard either you can use below any of the option.

Once you Pin your Visuals to you Existing or New Dashboard, upon accessing the same it should appear as below.
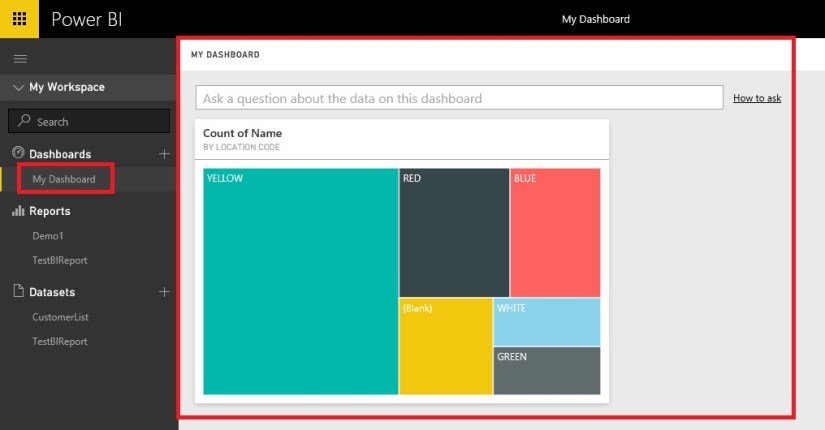
Ask a question
On your dashboard you may find “Ask a question about the data on this dashboard” let us understand this feature.
Here you can ask to analyse the data present on dashboard using simple English language include some column names or data values that are present. I will take as the filter for those value and present you the analysed data.
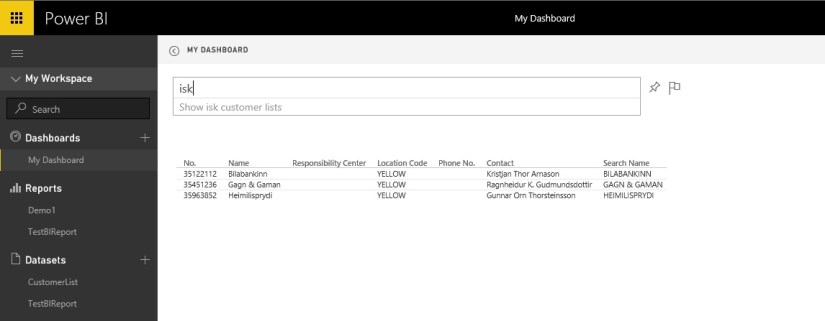
Let’s take an example I want to know all the customer who are associated with Red Location.
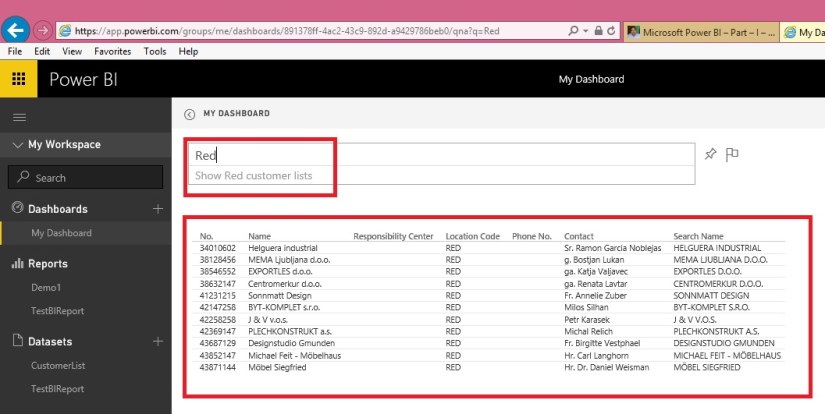
See I have entered Red in Question to Ask, it suggested me what valid question I can ask “Show Red customer lists” not only this it has analysed the data present on my dashboard and presented me the list of customers who are associated with RED Location.
Good feature and powerful too.
Filtering data across Visuals
Let’s add one more Visual on our Report, for this we edit our Existing Report.
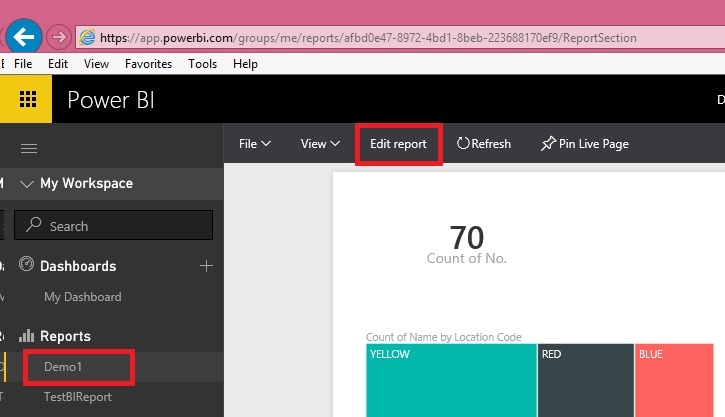
Select your report and click on Edit report

We select Credit Limit, Currency Code and No. field.
In value we will select “Count” for No. field. How to do it we have discussed in our previous post.
From Visualization we will select “Funnel”
Position the Chart at desired place available on your canvas.
Save the Report.
Now open the Report to View.
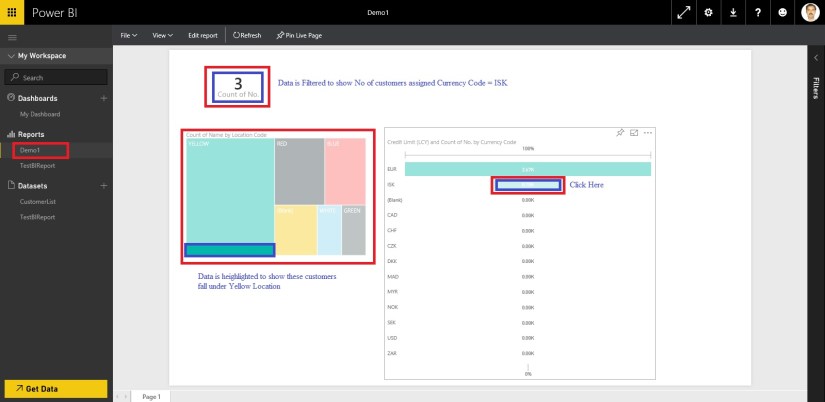
Click on the Funnel Chart on Currency Code = ISK.
Since all the tables/Visuals on this canvas share same data source/ dataset the data gets filtered.
See other Visuals are also showing the effect of same.
On Card Visual it Shows 3 Customers are which shares Currency Code = ISK.
On Treemap it shows these 3 Customer belongs to Yellow Location.
Yet another powerful feature for analysing the data.
Let’s add all of the above Visuals to our dashboard and arrange as below.
How to Pin the Visuals we have discussed above.

That’s all for today. We will learn and explore some more features in our upcoming posts.
Dear Friends from quite long time I was wishing to write few blogs on this topic, but due to some limitation I was unable to do so. I will be posting few blogs in this series using which any beginners can practice and have hands on to understand this concept and start using this powerful tool for visuals and reporting.
Microsoft Power BI brings your data to life, transforming your company’s data into rich visuals for you to collect and organize so you can focus on what matters to you.
An Overview:

What all you need to get started with creating reports.
To get started first of all we will be required to register our account to PowerBI.com
Go to this Link Power BI
Scroll down on page to find below

Here you require your company registered e-mail id, any private e-mail id for example Yahoo, Google, Hotmail etc. will not be acceptable.
Follow the onscreen guide to complete your signup.
Please use this link to access available downloads.

As of now we will use highlighted two components. Download and Install them. We will use and explore them in our upcoming posts.
At this step you are ready to start with using Power BI, you can design the Reports & Datasets on your in premise database and publish to Power BI.
We will use these components in our future posts, today we will have a quick report creation using data from Excel as our first Report. Here we go…….
Step 1- Collecting the Data.
Open your Navision and Export some data which we can use to create our first Report.
In my example I am going to Export my Customer List and save the Excel file, make sure your data is saved in Table Format else Power BI will fail to import data.
Step 2- Getting Data in Power BI from Excel using Get Data.
Login to Power BI using your credentials used above to register the Power BI.
From Lading Page perform below step:
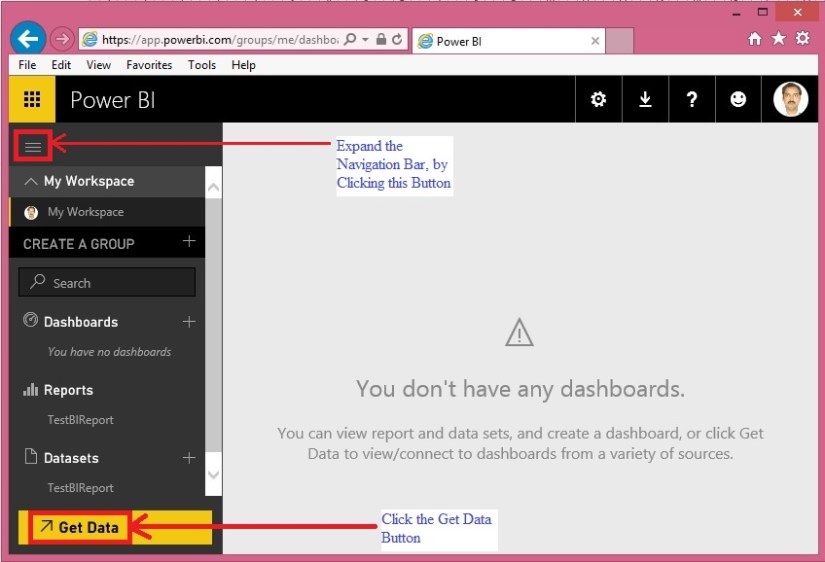
When you click to Get Data you will get options to connect with available data source options.

Click Get button as highlighted in above screen shot, as we are connecting the data from Excel file created in above Step.
On Clicking Get Button option available to get file will be displayed, depending upon where you placed your file select the desired option. In my case I have saved the File on My Desktop, so I will be using Local File option.
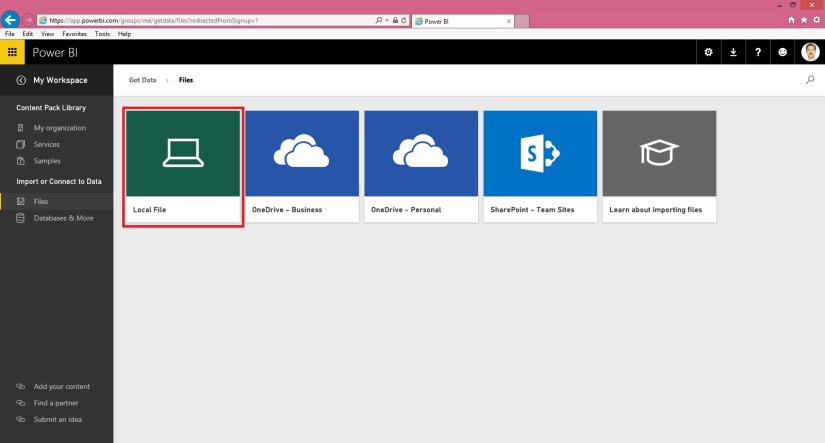

Select the desired file having data. In my case Customer List as created in above step.

Once done you will see a new Dataset and a Blank Report in Dashboard is added, in my case CustomerList.
Step 3- Analysing Data in Power BI or creating a Visual Report.
Click on the CustomerList dataset

This will show you the available Fields as per Excel columns, an available Visualization options.

Select the No. Field from the Field List, a list table will be added on the canvas as shown in above screen.
Here say we want to count the no of Unique Customers in the data.

From the Values of the Field we will choose Count Option.
At the same time to make data more representable we will choose Card Visualization.
The data will be formatted and displayed as:

Next we will add sum summary analysis Data.

Here we added two Fields Location (Value = Don’t Summarize) and Name (Value = Count). Visualization = Table.
A new table gets added on the Report Canvas as shown above.
Let’s change the Visualization of above Table to Treemap, the Table will get formatted as:

That’s all for today, we will see more features and other available options in our next blog.
Till then practice and read available blog, documentations and help available online.
Cumulative Update 5 includes all application and platform hotfixes and regulatory features that have been released for Microsoft Dynamics NAV 2016.
You can download the cumulative update from KB 3145855 – Cumulative Update 5 for Microsoft Dynamics NAV 2016 (Build 45243).
For information about how to install the cumulative update, see How to Install a Microsoft Dynamics NAV 2016 Cumulative Update.
For a list of all cumulative updates for this version, see Released Cumulative Updates for Microsoft Dynamics NAV 2016.

You must be logged in to post a comment.