
Dear Friends I will be continue from my previous post where we left. If you have not seen please check it out it will help you continuing with this post. You can check here.
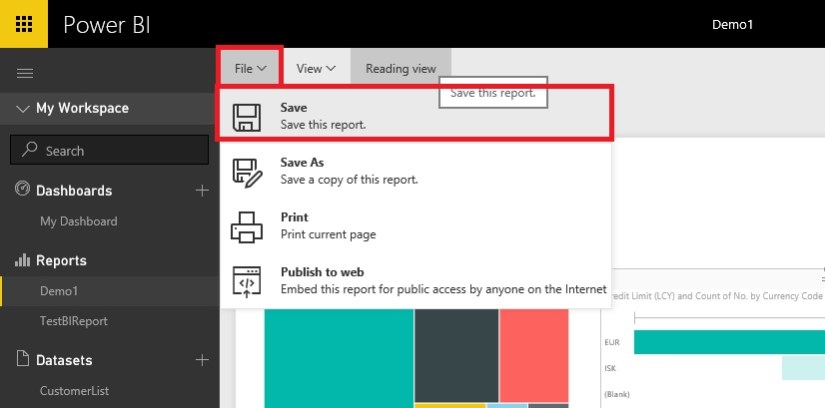
Let’s save the report we created in previous post and continue their after exploring more features.
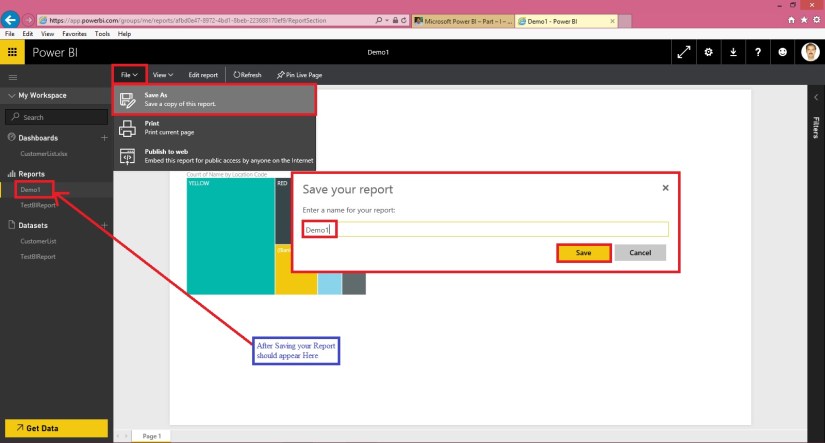
Create a Dashboard and Pin our Visuals.
To create a Dashboard either you can use below any of the option.

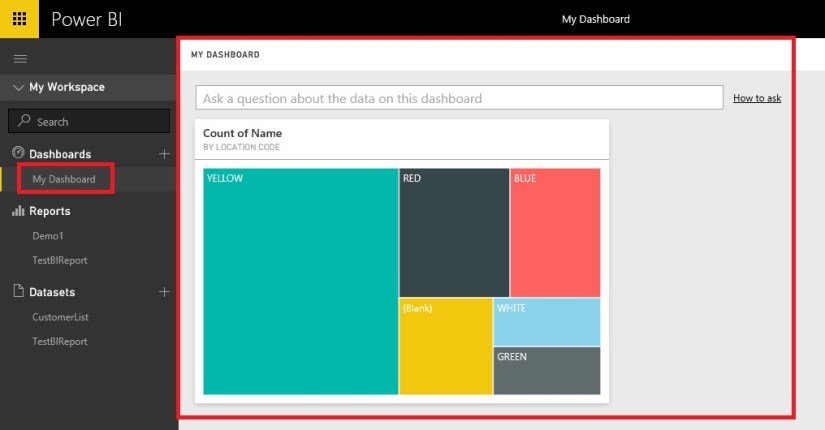
Once you Pin your Visuals to you Existing or New Dashboard, upon accessing the same it should appear as below.
Ask a question
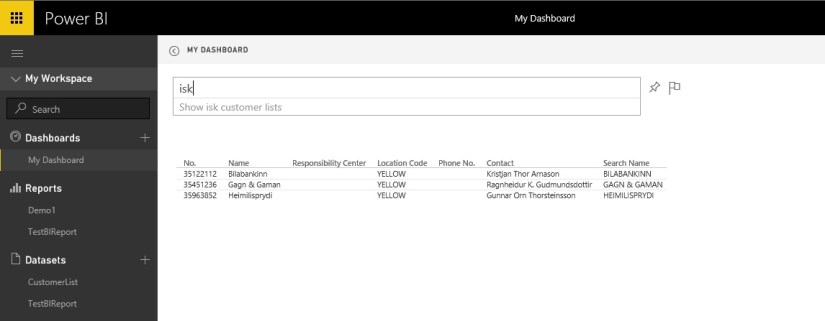
On your dashboard you may find “Ask a question about the data on this dashboard” let us understand this feature.
Here you can ask to analyse the data present on dashboard using simple English language include some column names or data values that are present. I will take as the filter for those value and present you the analysed data.
Let’s take an example I want to know all the customer who are associated with Red Location.
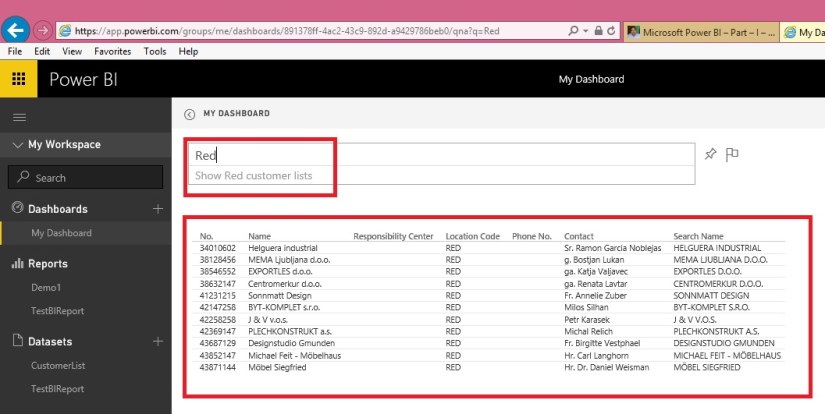
See I have entered Red in Question to Ask, it suggested me what valid question I can ask “Show Red customer lists” not only this it has analysed the data present on my dashboard and presented me the list of customers who are associated with RED Location.
Good feature and powerful too.
Filtering data across Visuals
Let’s add one more Visual on our Report, for this we edit our Existing Report.
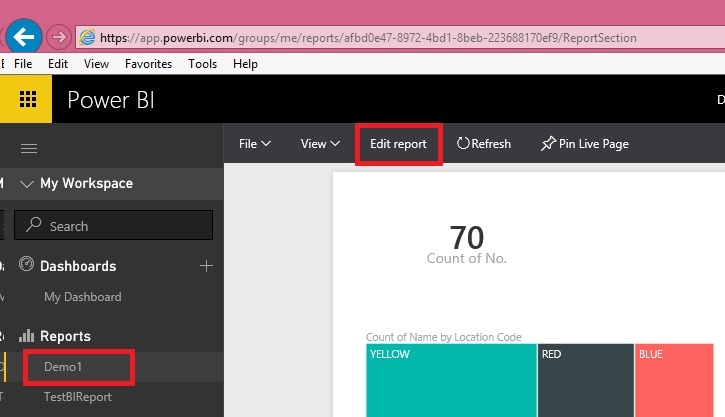
Select your report and click on Edit report

We select Credit Limit, Currency Code and No. field.
In value we will select “Count” for No. field. How to do it we have discussed in our previous post.
From Visualization we will select “Funnel”
Position the Chart at desired place available on your canvas.
Save the Report.
Now open the Report to View.
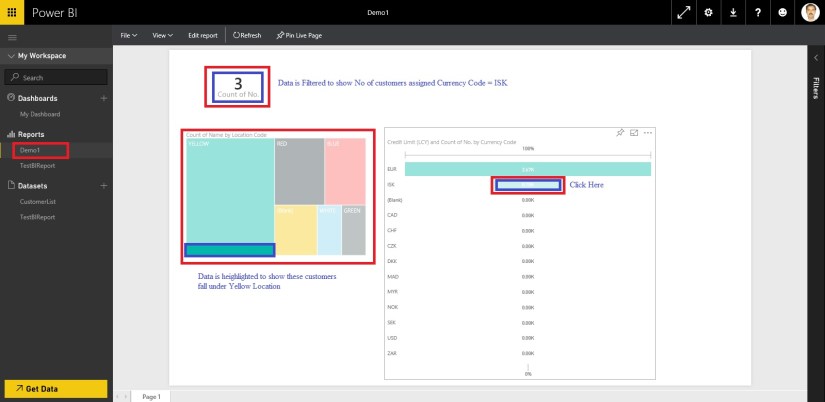
Click on the Funnel Chart on Currency Code = ISK.
Since all the tables/Visuals on this canvas share same data source/ dataset the data gets filtered.
See other Visuals are also showing the effect of same.
On Card Visual it Shows 3 Customers are which shares Currency Code = ISK.
On Treemap it shows these 3 Customer belongs to Yellow Location.
Yet another powerful feature for analysing the data.
Let’s add all of the above Visuals to our dashboard and arrange as below.
How to Pin the Visuals we have discussed above.

That’s all for today. We will learn and explore some more features in our upcoming posts.

6 thoughts on “Microsoft Power BI – Part – II”
Comments are closed.